


Way up north, north to Alaska!
North to Alaska, go north, the rush is on!

Good luck getting that song1 out of your head now.
Because below that old white mountain, just a little south-east of Nome, Big Sam found himself a bit of data. But you know — things up here are not quite as accessible as one might always like, so it takes a bit of work to get to the prettier places. At the moment we’ve got the dogs tied up and are camped out below this mountain range — see if you recognize it2:

There’s quite a bit to unpack here. First thing though is we need to get a hold of the numbers in these numbers. Alaska dept. of health doesn’t really make this easy to find out3, and unfortunately due to I’m sure innocent omission on their part, this does not seem to be included in the CSV’s one can download there.4
Fortunately though there’s a trick we used to do back in the dark ages before the advent of the Web, with its free and open data availability everywhere. Often you’d be in a situation where you wanted to compare the results from a past experiment, sometimes quite many years prior, to a phenomenological prediction or even measurements from your current experiment. But you wouldn’t necessarily be able to just go download a CSV or json or hdf5 whatever — often you’d only have a photocopied plot out of a journal or conference report, hard won from a long and dusty search through the stacks. So what you would do then is blow the thing up5, get out the ruler and extract the numbers from the plot from a direct physical measurement. Sometimes, if you got lucky you got a copy of a postscript file from the thing and found the numbers were actually encoded in there. Usually you ended up slogging through with the ruler though.
So. We printed this sucker out and employed this ancient skill. Being here in The Future though, we can now use some pretty fancy high tech to help us along. Digital calipers. So now I have the numbers in a spreadsheet — here’s my version of the plot:

I think it looks pretty darn close. Alright — I didn’t go and get the error bars in my version — I probably should have, but the potatoes for dinner already boiled a bit more than I wanted while doing this…
What are these different colored bars, and what is this showing us? The vertical axis, is as the original covid “cases per 100,000 person-days, age-standardized”. OK — so this is covid case data for Alaska, delineated into unvaccinated, vaccinated, vaccinated+boosted categories in some way. The notes under the original plot states: “In order to more easily identify changes over time, the definition of “up to date” as of January 8, 2022 was applied to data from all time points.” I’m using “boosted” as a synonym to their “up to date”.
I am pretty sure the two vaccinated categories are not quite mutually exclusive, and each are scaled to 100,000, relative to their respective populations — I.e. the value in each week for unvaccinated people would be number of covid cases divided by number of unvaccinated6 people there were then. So you can’t just add these — each one is divided by a different population number. These are basically percentages within their respective populations, but scaled to 100,000 rather than the 100 you usually do for a percent. This seems to be a biology thing. Rarer things go per million sometimes.
The “age-standardized” I’m taking to mean they do this division by relative populations within groups of similarly aged people. I suspect also this is the origin of their error bars, that they’re combining the statistical errors of each subgroup to do this right. So if they’ve indeed done this right, they’re actually correcting differences in relative age populations in the different samples for me. Making what I’m about to do possibly almost legal.
OK. If you’ve been here before7 you can probably guess where I’m going. We’re going to see if we can plug these numbers into this:

And get our effective vaccine efficacies. This is the famed “95%” we hear about from the vaccine trials. So I’m going to do this both for the “green” and “purple”. The boosted and nonboosted vaccinated populations above. What does this look like?
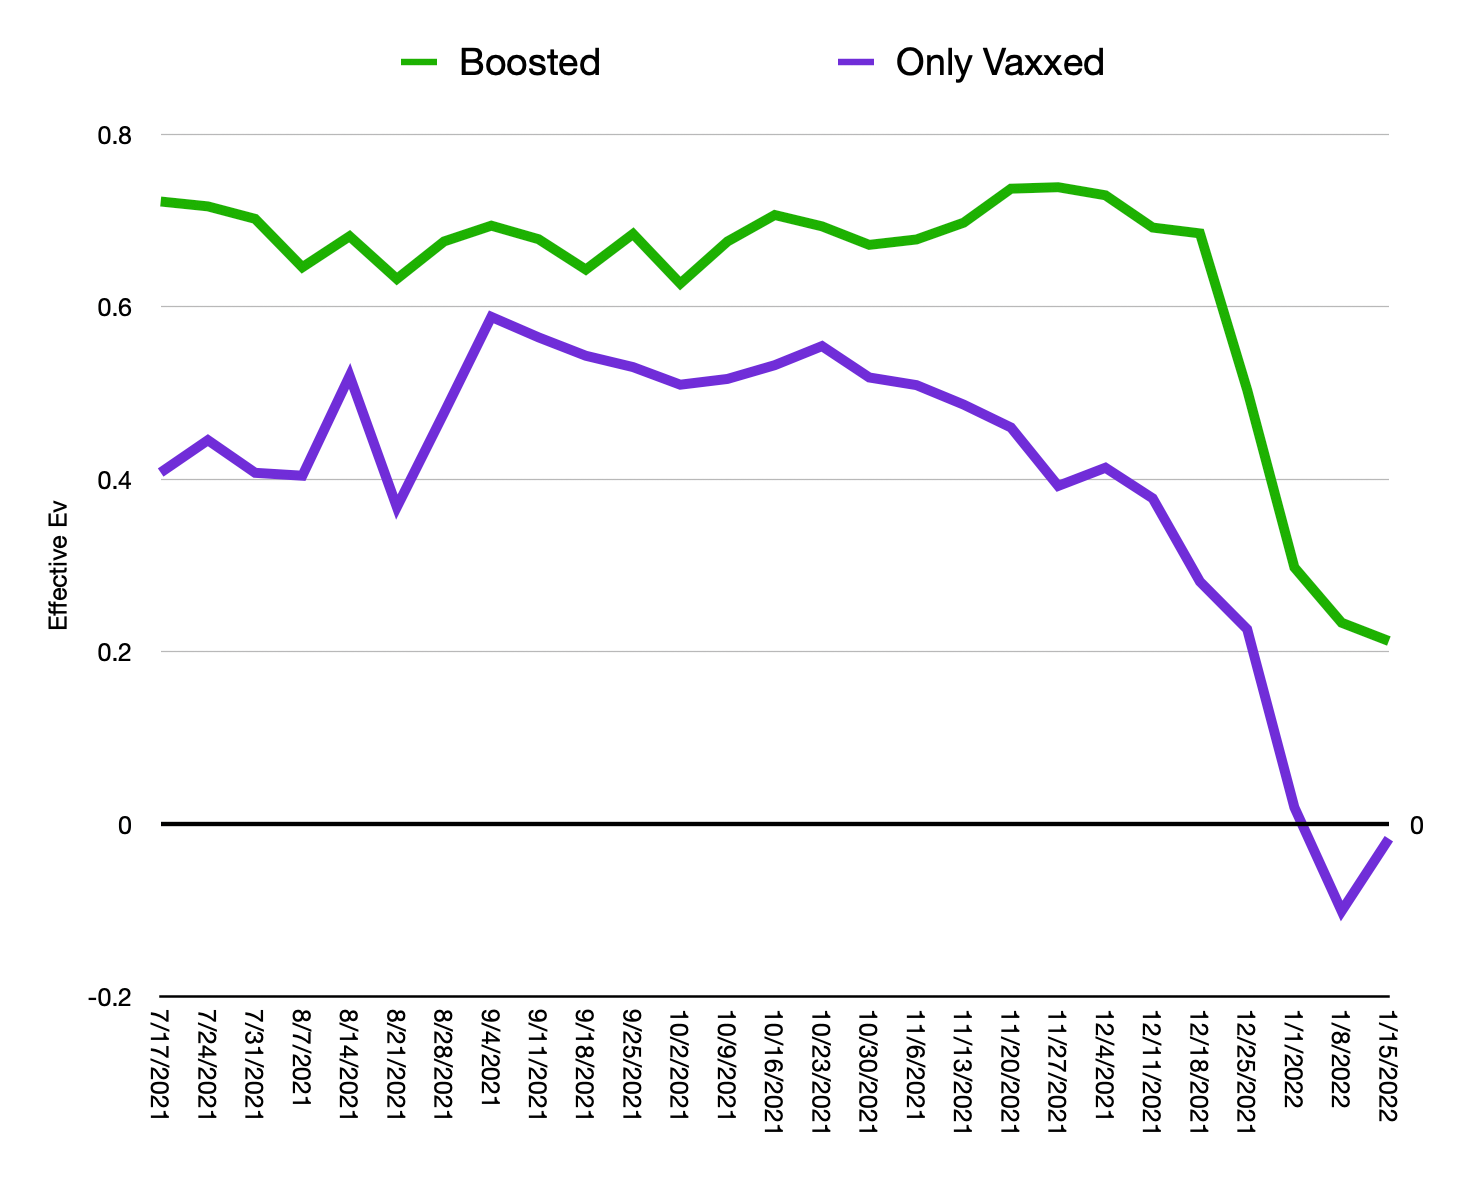
Does this at least subjectively look familiar perhaps? This by the way is where I’m really kicking myself for not going through and putting in the error bars in this — definitely in July8, before the delta surge peaks in fall, those wiggles will all be within the bounds of expected statistical fluctuation. Otherwise what we see there is in fact consistent with what we’ve seen elsewhere — for some combination of boosted or unboosted, we have Ev sitting in the 60% range. Clearly people they’ve designated as “not up to date” and I’m calling “only vaxxed”, have some pretty miserable numbers — ~50% throughout the fall. Thats a coin flip. Risking non negligible risk of injury9 or worse for a coin flip? And now with omicron we’re looking at zero, and also approaching zero even if boosted.
Very interesting and sad what we’re seeing here. Not what the people in green or purple were promised — there’s some indication of a range of efficacy within the vaccinated population, presumably depending on how long in the tooth that last dose was. Neither all that good, and now they’re clearly tanking with omicron. Boosters too.
But its OK — a 4th one is clearly the way to go here isn’t it? Obviously seems worth force injecting kids with this stuff too.
https://genius.com/Johnny-horton-north-to-alaska-lyrics. Get it playing on loop while reading this.
https://dhss.alaska.gov/dph/Epi/id/Pages/COVID-19/weeklyupdate.aspx and with global warming and all, things might melt, so snapshot here: https://web.archive.org/web/20220126233626/https://dhss.alaska.gov/dph/Epi/id/Pages/COVID-19/weeklyupdate.aspx
In fact honestly they can’t. We live in a world where medical professionals truly risk their careers if not worse, if ANYTHING counter to the “fully vaccinated” path is conveyed. Observe how quickly this:

Needed to be published only days after this:
https://rumble.com/vt62y6-covid-19-a-second-opinion.html
And anyway if you haven’t watched that yet, make the time. Yes. all 4 hours.
https://covid-19-csv-files-database-alaska-dhss.hub.arcgis.com/ But again, see #2.
with a photocopier.
To be vaccinated appears to be the usual two doses of vaccine (for 2 dose vaccines) + 14 days. If not that you’re “unvaccinated”. They also claim to have put forth some effort getting vaccination status from their state vaccination database — according to https://dhss.alaska.gov/dph/Epi/id/Pages/COVID-19/weeklyupdate.aspx

I can’t say I even understand what the difference means between these two curves before boosters — i.e. before August…
https://www.skirsch.com/covid/Deaths.pdf