

When in Utah, DON'T Get Boosted!
When in Utah, DON'T Get Boosted!
Obviously though when floating in a salty lake, you need something to help push you underwater...

Well. I was peeking back at where things were going in the few states I have found available vaccine breakthrough data. I hadn’t caught up on the data since omicron burned out, and was curious to see where things stood.
I of course went to Oregon1, and saw they’ve introduced a ‘boosted’ category to their breakthrough data. I hope I can post something on that in some number of weeks, but honestly am confused with what I’m seeing right now. Efficacy crashes in the last two weeks they have2, which is interesting, as it maybe also coincides with BA2’s arrival there, but the drop is also very artificial looking — like from 40% to zero from one week to the next. They also missed last week’s update, which is also unusual. Something’s up. We wait, watch and continue to not let anybody near us with a needle.
And well, while scratching my head over what I was seeing in Oregon, I started touching base with other states to see if similar things were going on. I landed back in Utah. I really like Utah’s data3 on this — they give us day by day, now also broken out between “full series” and “boosted”. I’m going to give you a series of busy plots, then try to explain what I’m doing and what I see in them, starting with the case data since January 2021:
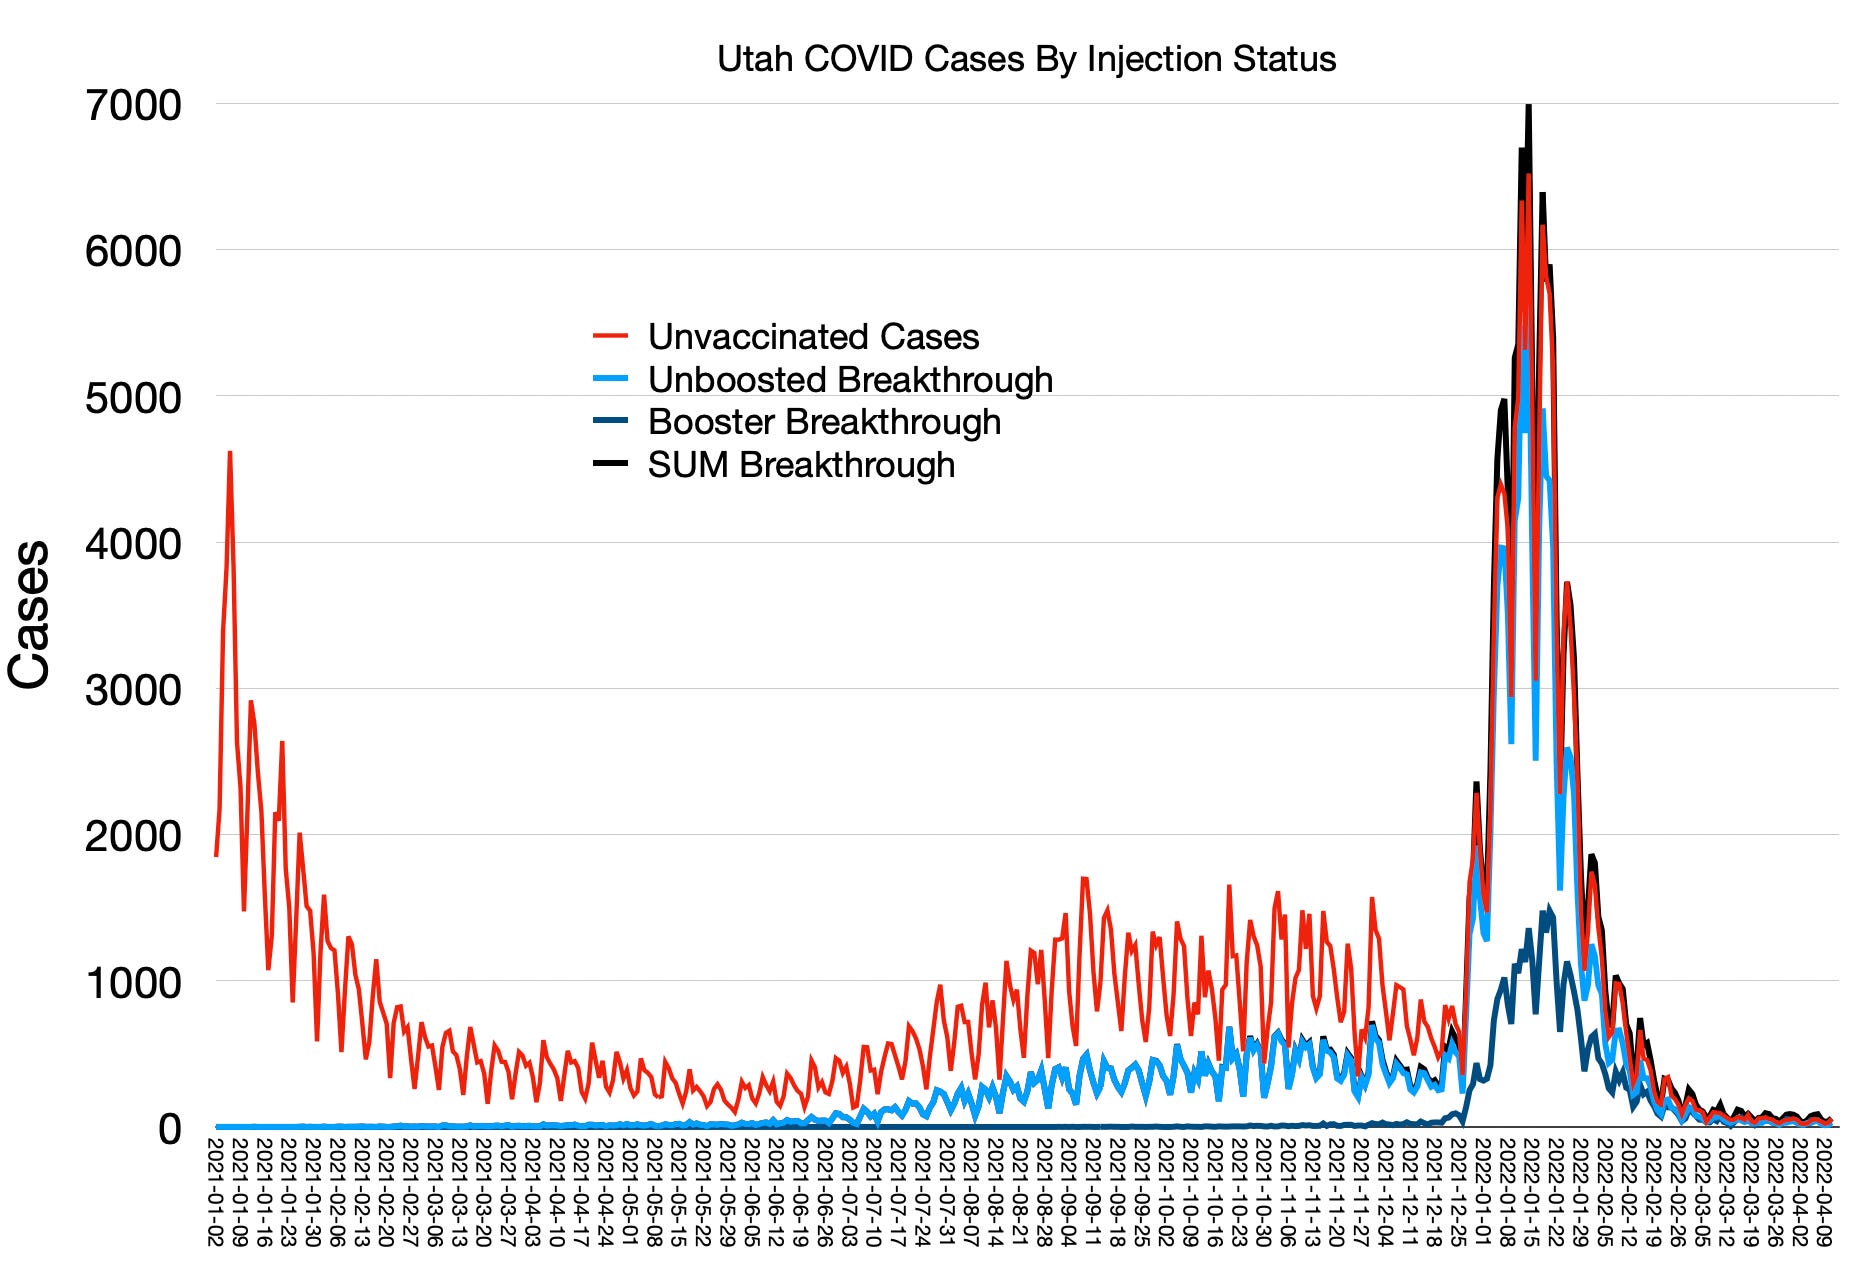
Alright — these are daily covid case counts for the various categories over time. The zigzagging up and down is due to the weekday/weekend cycle. Low on weekends, picks up during week. Bet you didn’t know coronavirus followed the work week so strictly4… The data is provided in 3 mutually exclusive categories: “Unvaccinated”, “Vaccinated, Full Series”, and “Boosted”. As is convention with these things, people who have not had the full series of their respective shot — the 2 for Pfizer and Moderna + 2 weeks, are counted as Unvaccinated. Cases attributed to this class of people are in red above. Then light blue corresponds to “full series, but not boosted” people. The smaller bump in January 2022, in dark blue then, are breakthrough covid cases among those fully injected + boosted.
One thing that I’ve added, that you do not see on any of Utah’s public pages is an additional black line. The additional black line is the sum of “full series” and “boosted”. The reason I do this is actually all the boosted people, by definition are ALSO “full series”. But publicly they’re presented separately. There is I believe a reason for this, and that reason is the black line. You can see in the omicron peak that the black line actually gets higher in places than the red. The black line is all vaccinated people, boosted or not.
It turns out the following is an absolutely true statement based on Utah’s data: “So far in 2022, more fully vaccinated people in Utah have tested positive for covid-19 than unvaccinated people”. The data I have is through April 11. 147,041 fully vaccinated vs 136,666 unvaccinated people at this point this year have tested positive in Utah. Of course we need these numbers in context though — if a huge number more were vaccinated than vaccinated, it would tell a different story than vice versa. If you’ve been here before you know where we’re going. My favorite equation:
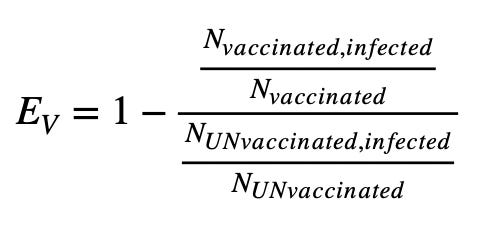
Actually, let’s see what this number is so far for 2022:
   Nvaccinated,infected    = 147041
   Nvaccinated             = 2005916
   NUNvaccinated, infected = 136666
   NUNvaccinated           = 1332059
So OK — we’re probably going to get a positive number at least — there’s quite a few more vaccinated people in Utah than unvaccinated. They’re at 60% vaccination. Lets plug these numbers into the above…. I get 0.286. 28.6% Efficacy5 from cases this year so far, which by the way includes about half the vaccinated population also being boosted. As you know though I like to look at this as a function of time — so we need the various populations over time:
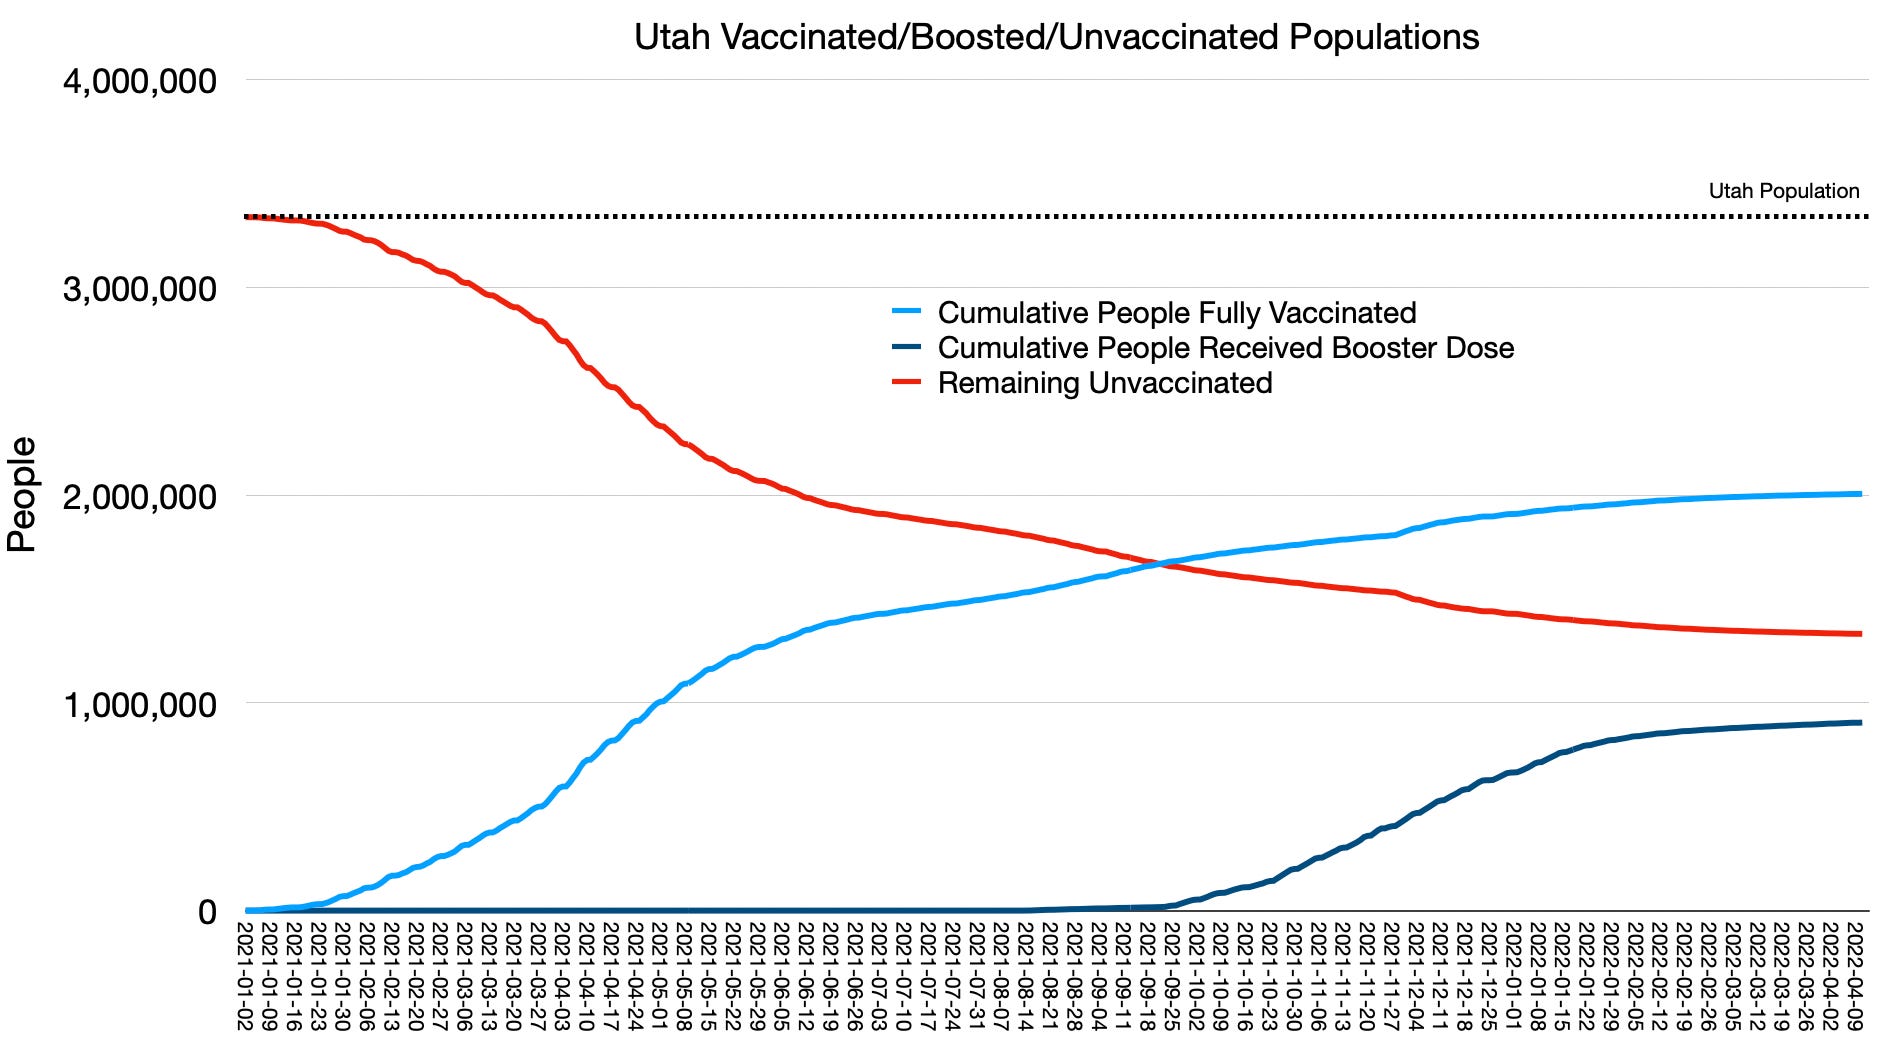
This is plotting, like above, from the beginning of 2021, when the shots first became available, to April 11, 2022. We start with all 3 million Utahns unvaccinated, then like everywhere else steady growth of the vaccinated population through spring 2021. There has been a slower rise since, with more or less a plateau since the omicron outbreak. You can see overall vaccinated and boosted in the two shades of blue. Here the light blue is vaccinated + boosted, so all fully vaccinated So now the fun begins — we take these numbers and the numbers that made the case plot above and make the following mess:
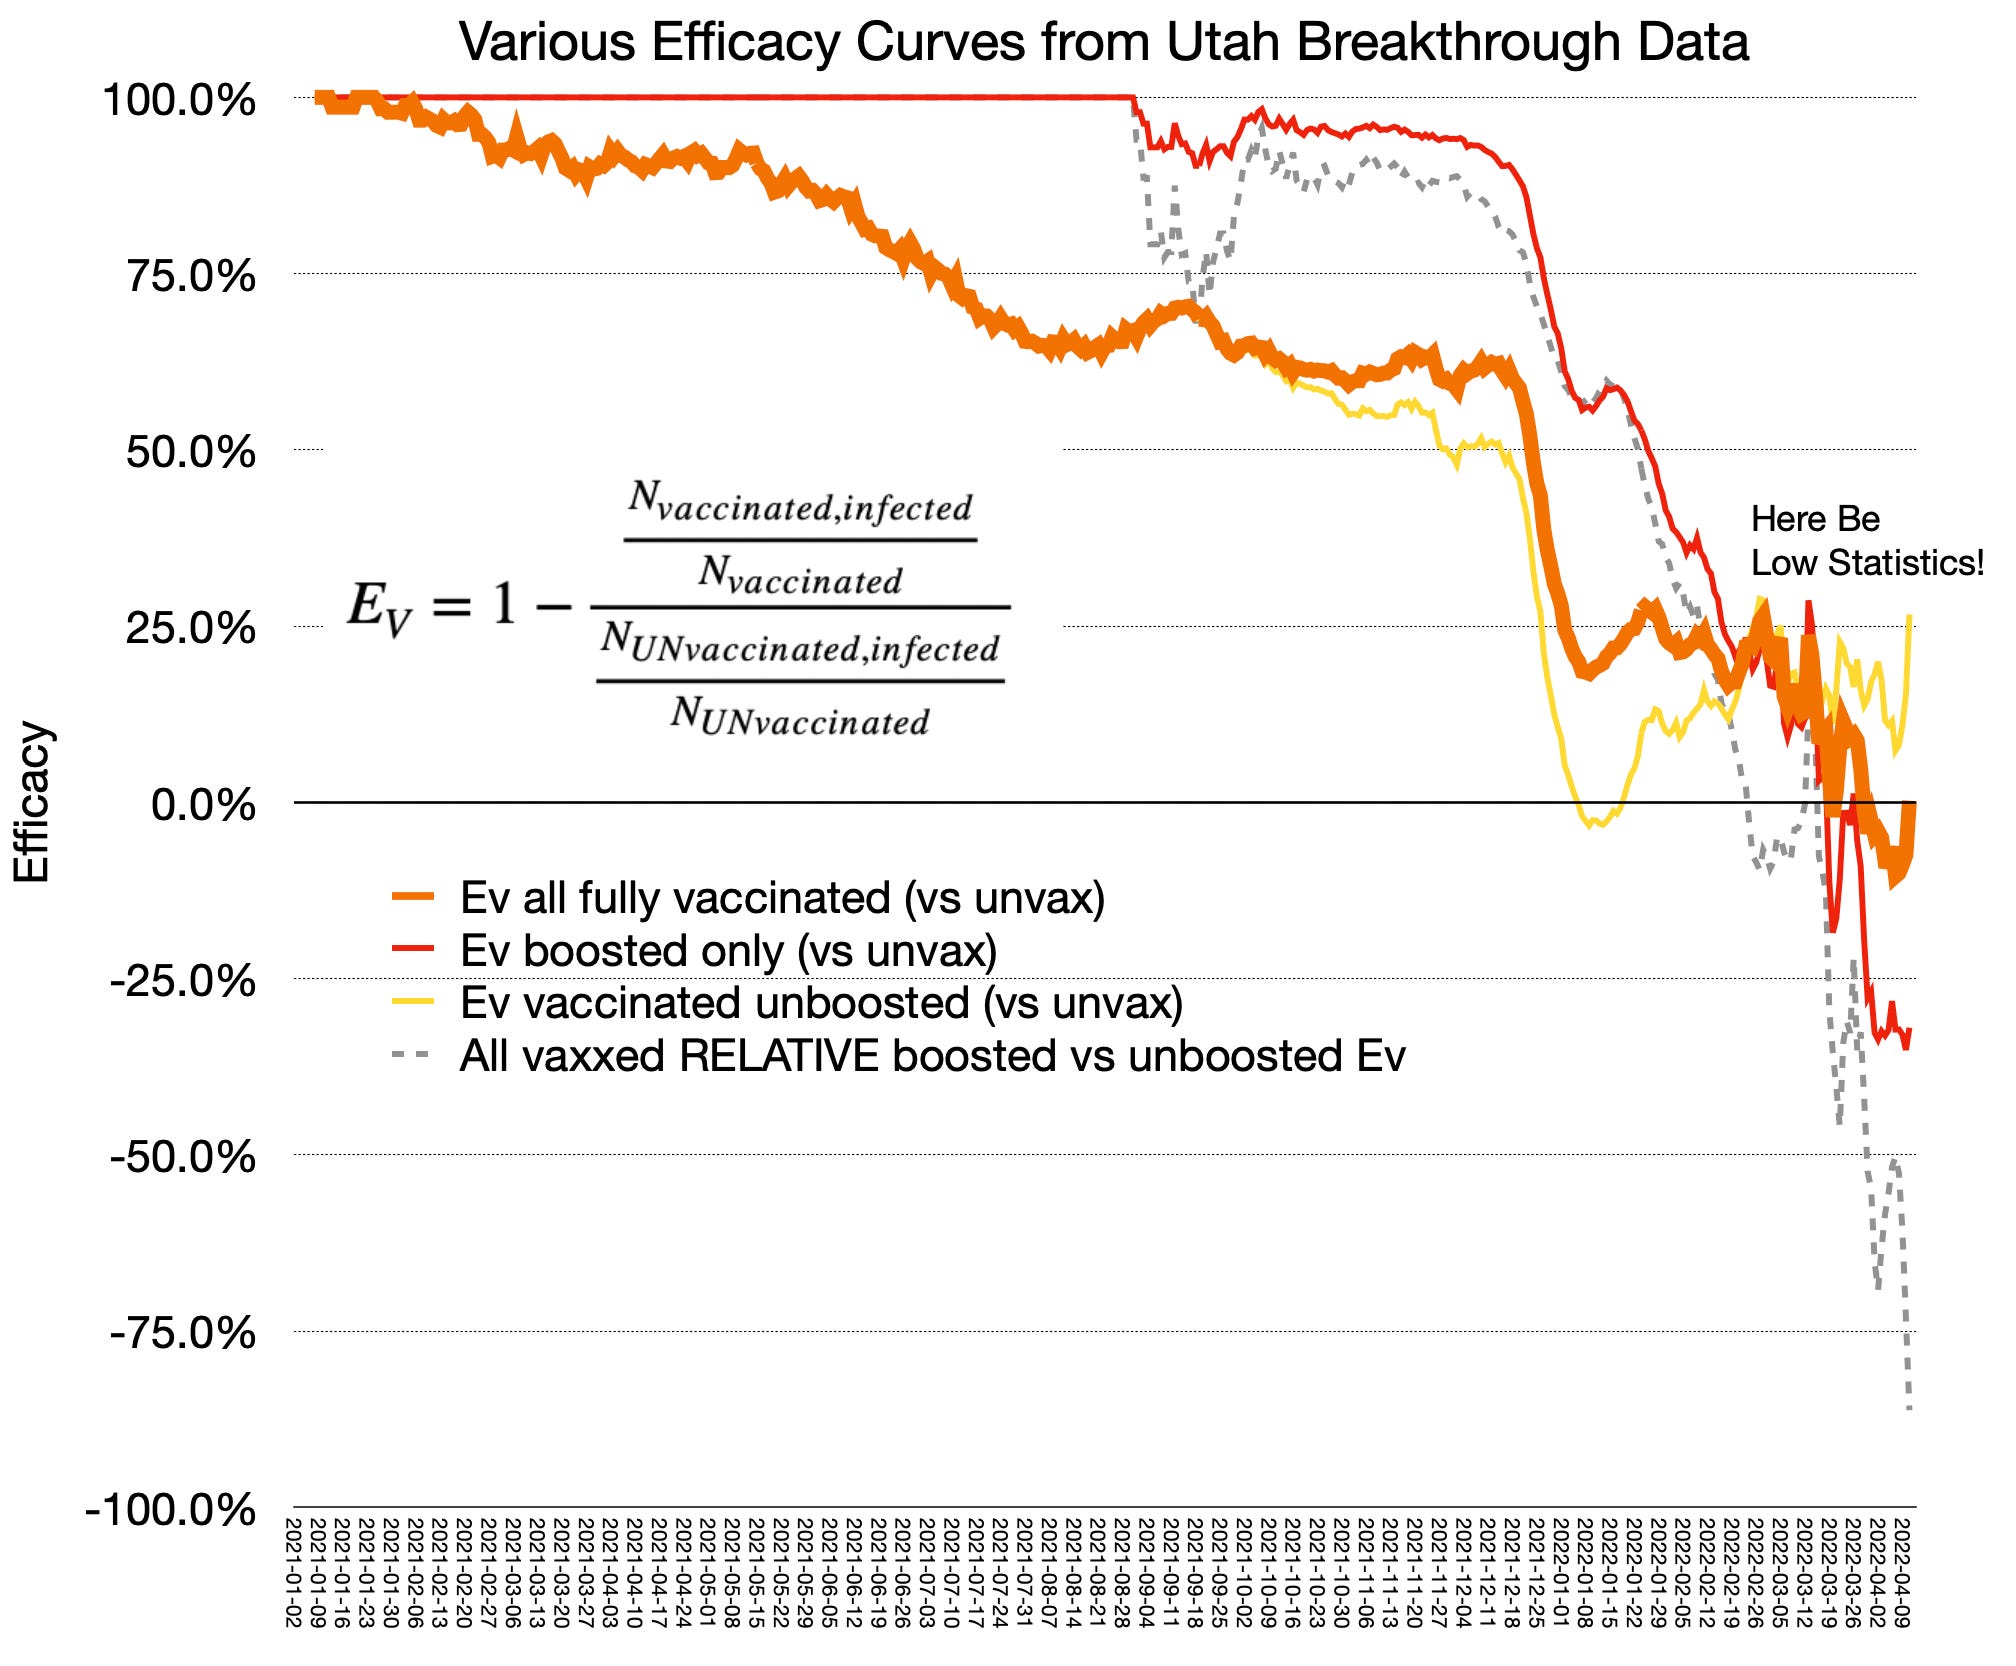
This is a very busy plot. There is a lot here to unpack. To make things easier to see, the curves are using 7 day running averages of the case counts. Otherwise you’d see the 7 weekday zigzags like I left in the top plot (which was just raw day to day numbers).
Let’s start with the orange. The orange is the standard vaccine efficacy over time. All vaccinated people, boosted or not, vs unvaccinated. We’ve seen some of this story before — starts off really high, before there were many vaccinated people to get infected in the first place. Then in the delta outbreak last fall it settles to around 60-70% effective, then crashes to around 25% for omicron this winter. But look. Its diving down further now. It appears to even go negative. Strictly speaking negative efficacy means it makes vaccinated people more likely to get covid.
Take note of my warning on the right of this plot — cases are low, so statistics are low. Statistically there are a lot of fluctuations, such that its not really clear you can say the efficacy really dips below zero in these last few weeks. Its certainly close and effectively zero however. Zero means you might as well have shot up with saline. Perhaps we should suggest a saline mandate. It’s safer at least.
Alright — what are all these other curves? Here I’m taking the data Utah has broken up into components for me and trying to get some sense of the contributions boosted vs not boosted add to this story. In the plot above then, I calculate Ev independently for the boosted (red), vs the not boosted (yellow) populations. I tried a “red + yellow makes orange” sort of theme there. So OK this sort of looks like you’d expect, the boosted population seems to do better — they’re higher than the combined orange in the beginning, with the yellow, not boosted being below. This is starts off more or less like we’ve been told — boosting helps restore efficacy.
But what the heck is going on this last month? Yellow and red cross each other in March, where the unboosted seem to now be helping keep things afloat, albeit waterlogged, rather than the boosted? In fact it looks like boosted are dragging the overall efficacy underwater starting mid March. From this it looks like after a month or two (we don’t really know from this, since this is just plotting in time overall passed instead of time since injection) the boosters shift from helping to hurting your chances of testing postive. Thats actually where my grey dotted line comes in.
So I have the number of boosted people, I have the number of unboosted people each day, and then the case counts for each. From this I can calculate a boost efficacy relative to the rest of the vaccinated population — in other words I can try to plot how effective the boosters are for just the vaccinated population. That is the grey dotted line there — boosted in the top fraction of Ev vs unboosted, but vaccinated in the bottom. So this seems to be telling me we have a month of two where we get back up to 90-ish % efficacy with the booster, but then a terrible crash such that it actually reverses the gains and appears to make it more likely to get covid. When the grey goes negative its doing damage.
Is this a sign of vaccine induced immunodeficiency6?
We need to watch closely what happens here. We need to make sure we don’t stop recording this data, though there are certainly trends, like home testing, that will make seeing this harder.
We need to be careful jumping to conclusions too — we’re post omicron with low cases in Utah — statistics are low which means uncertainties in these ratios is high. We also do not have (and never did have) any picture of what natural immunity and false positive tests contribute to this.
It is though the data we have. And that seems to be screaming ever louder STOP.

April 7 at this writing: https://www.oregon.gov/oha/covid19/Documents/DataReports/Breakthrough-Case-Report.pdf
https://coronavirus-dashboard.utah.gov/risk.html. for their dashboard, but the actual data is here: https://coronavirus-dashboard.utah.gov/Utah_COVID19_data.zip. Whole series of csv files for various things. Their dashboard shows things BTW age adjusted and per 100k, which is hard to work with when you’re trying to differentiate between boosted or unboosted/unjabbed. The raw case counts are in the csv’s in the zip’s and are what I use here. Populations of each category are also there.
Well, OK the people who count cases do though.
You might, as I did, later on scratch you head how this is as high as 28%. It turns out this number is dominated by the larger case loads early in the year when there seemed to be also a bit higher efficacy than we see later. This number isn’t just a by eye average of the plots I have later on in this post. Oh crap I’m giving away a punchline maybe.
https://www.voiceforscienceandsolidarity.org/
Hi Flurm, great article, over my head a bit, but I think if I study it more, it will sink in.
Curious are there other numbers crunchers who you yourself follow? Do you ever find mistakes...in logic or data or interpretations?