

Some VAERS Updates
Some VAERS Updates
Just some quick plots of COVID and non-COVID reports

I was going to wrap more of a post around these (OK, though maybe I did anyway), but wanted to loft these plots over in a comment to Steve Kirsch, in his post this morning:

Which is completely right, but I think I have some better plots to show this.
Steve’s post is addressing a common excuse for the huge increase in reporting to VAERS1 in 2021 and 2022 versus past rates. That “more people are aware of it now. Nobody knew what VAERS was before covid”, despite such reporting having been legally required2 for decades.
He is correct that the rates have not increased, and you can see this clearly if you look at the reporting rates of NON-COVID vaccines:
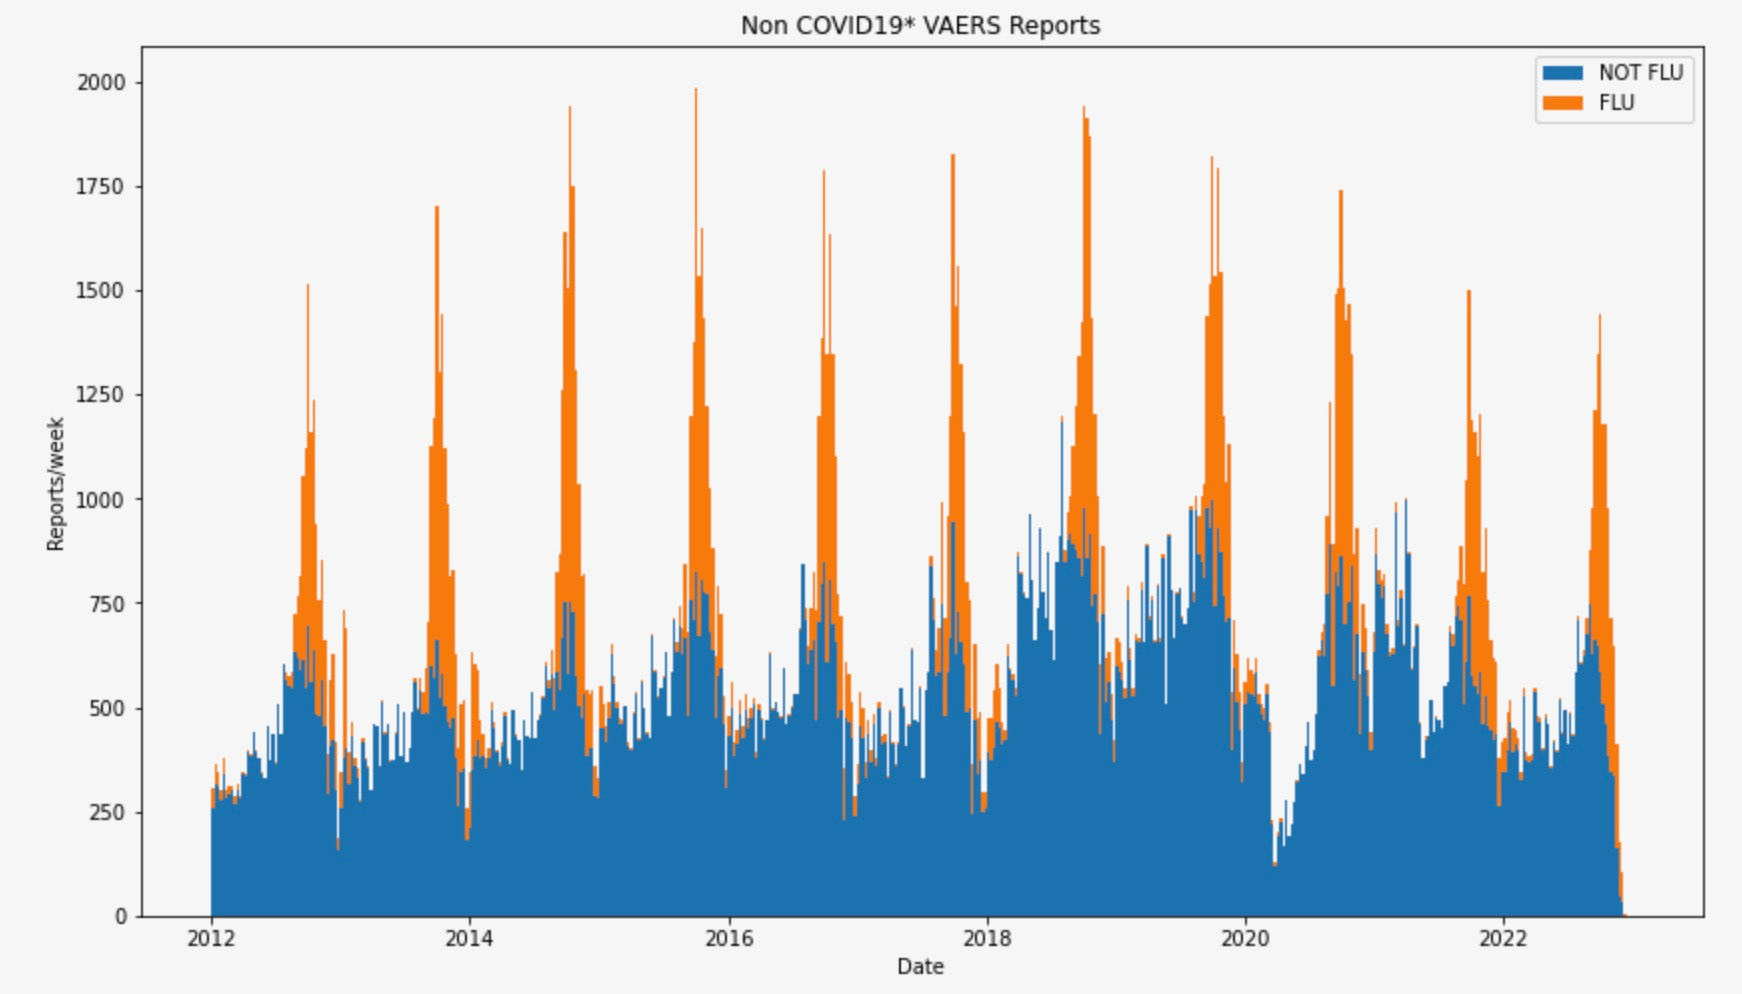
This plot counts up the number of weekly reports for non-covid VAX_TYPE’s based on the latest VAERS data from December 16, 2022 (which includes reports through December 9). I made this a few days ago when looking to see if flu reports have increased in particular lately (I think they haven’t). But more generally, this is a very good illustration that the general VAERS reporting rate has not really changed over the last decade.
Here I’ve highlighted the FLU3 shots (orange) from everything else non covid (blue). You can see their seasonal pattern, given each fall, from the corresponding orange pulses of adverse event reports here in VAERS. You might look at this and declare “Oh my goodness! Look at all the adverse event reports! We need to stop these flu shots!”
Oh just wait.
The annual pattern of these orange and blue are pretty stable in this plot, with one exception — the crash due to lockdowns in March of 2020. You can see that notch clearly in blue right after 2020. Blue would be reports due to predominantly the dozens of childhood vaccines that are given to US babies and children all year long. It looks like after that initial period of nobody going to see the doctor for routine checkups in 2020 though, we more or less get back to the steady historical rate of reports by 2021. Given this is a plot if adverse events, I probably needed an “unfortunately” there.
OK.
But what now with covid? I deliberately removed it above to see if the "background" shot rate changes much. Which I would say does not change except for the temporary decrease due to lockdowns.
Alright. Lets add covid4 shots back into the plot then:
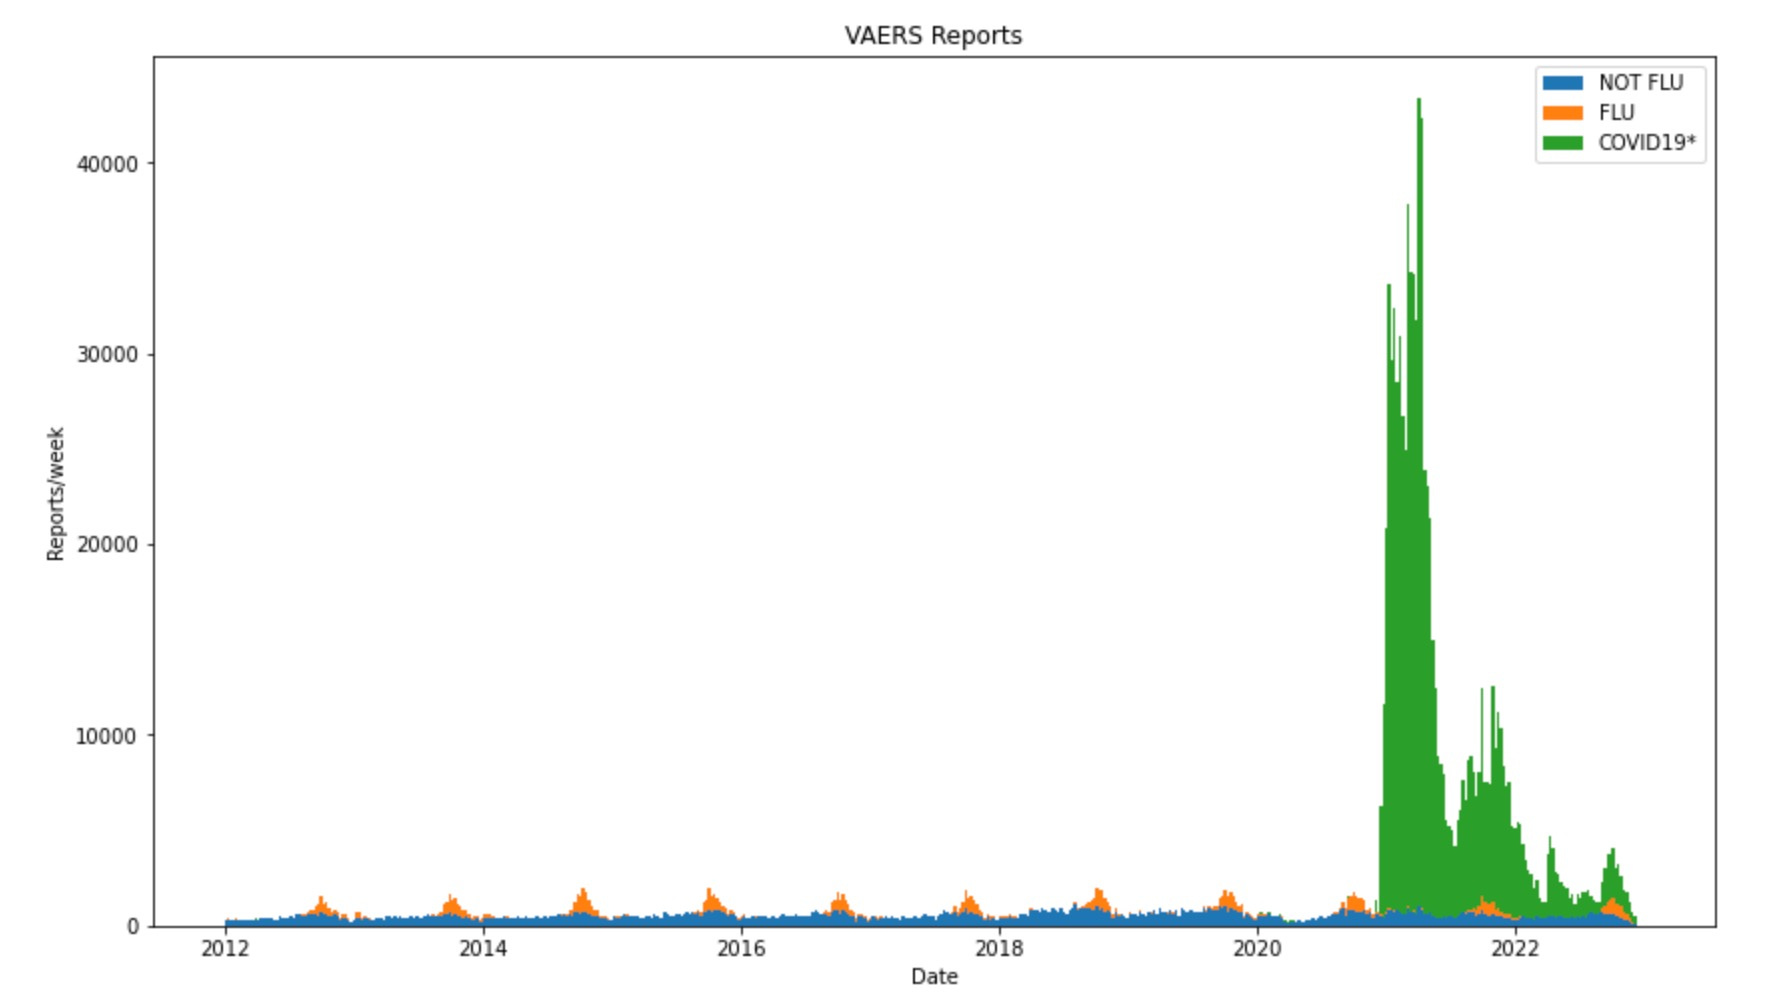
Boom.
And here you get back to a place where you see the covid transfection shots obliterating the scale of what we perhaps used to accept as ‘safe’.
And they did so nearly two years ago.
https://vaers.hhs.gov/. Plots here are from the Dec 16 data drop, and I only use the domestic reports.
https://vaers.hhs.gov/reportevent.html where it states:
“””
Healthcare providers are required by law to report to VAERS:
Any adverse event listed in the VAERS Table of Reportable Events Following Vaccination that occurs within the specified time period after vaccinations
An adverse event listed by the vaccine manufacturer as a contraindication to further doses of the vaccine
“””
Actually I hadn’t noticed the “within the specified time period after vaccinations” bit. Thats something to follow up…
I’m selecting all the VAX_TYPEs that start with “FLU”. There are several varieties.
covid shots being those with VAX_TYPE either of COVID19 or COVID19-2
On my to-do list from a twitter comment, normalizing each of these by number of shots applied. This would give an indication of relative harms of each category of shot, and also give some picture of how much of the covid report decline this past year would be due to fewer shots given, or formulation changes/reporting bias changes/vulnerable population culling, etc.
Though we do see from the non-covid plot above that there does not seem to be a “more people know about VAERS” enhancement, we can’t address the “well there just were so many more covid shots” dismissal of that explosion with these alone.
Can you remake your chart with the boosters added? 😂
Or what about a chart of Covid cases versus cryptocurrency prices! 😂