

Of Mice and Pantsuits
Of Mice and Pantsuits
We next journey to the Golden State.

We are continuing to wander around the US, looking to scrounge up bits and pieces of covid vaccine breakthrough data that the occasional health departments are leaving around for the birds to pick on. So far we’ve revisited Oregon and wandered up North to Alaska. Today we’re going to hop south to California. Still not sure for one thing that I believe that whole Minnie Mouse pantsuit business.
California has some really nice data1 to play with - nice in the sense that it is in the form of CSV files that I don’t have to get out digital calipers to do anything with, and that its nicely separated out into case counts for each day, for nearly the entire year of 2021. Their webpage shows the post delta outbreak case rates, separated into their Unvaccinated and Vaccinated groups2:

OK — so at this point if you’ve been here before you likely know this dance by now — I’m going to take this and plug it in here:

This is called the “Efficacy”3 and is usually represented as a percentage. It is a measure of protection from the relative risk of vaccinated people getting covid (top half of the double fraction) vs unvaccinated people from getting covid (bottom half). If vaccines were completely effective, the Nvaccinate,infected number would be zero — nobody thats gotten the vaccine would be infected. That zero makes Ev = 1-0 = 1, which is 100%. The bottom half of the fraction gives the relative rate of infection, “attack rate” for unvaccinated people — the “control” half of the equation. If the vaccine you’re testing does nothing, you’d expect to see the same rate in each half, same number of infections in each, relative to their populations: Ev= 1 - 1 = 0 = 0%. If you’re in a situation where somehow more vaccinated people, relative to their populations gets infected, you can get Ev = 1 - (something>1) = a negative number. So keep this in mind when you look at these numbers.
Also keep in mind that the intent of the construction of this number is to try to identify these populations in such a way that you can be as confident as possible that other things aren’t preferentially affecting each half of the fraction. Ideally you probably do this kind of thing with lab animals in boxes that you can control every aspect of their lives, including apparently their evolutionary history4, outside the difference of applying the drug.
But I’m calculating this from massaged public numbers with all the problems that involves, attempting to track people doing all the normal people-y things people do, with differences and biases (i.e. one population tending more to mask than other, one tending to go out to bars unmasked — maybe not the one you think, regional differences in infection rates, etc). Yes. Understood. We go forth anyway. Keep in mind too though, Pfizer & Friends did not cage up their subjects when they came up with 95% for this5. We can probably pretty easily stumble over the low bars they set for us here.
Which…. brings us back to California. So I come back to that data, and plug each day’s worth into the Ev equation above. Here’s what I get:
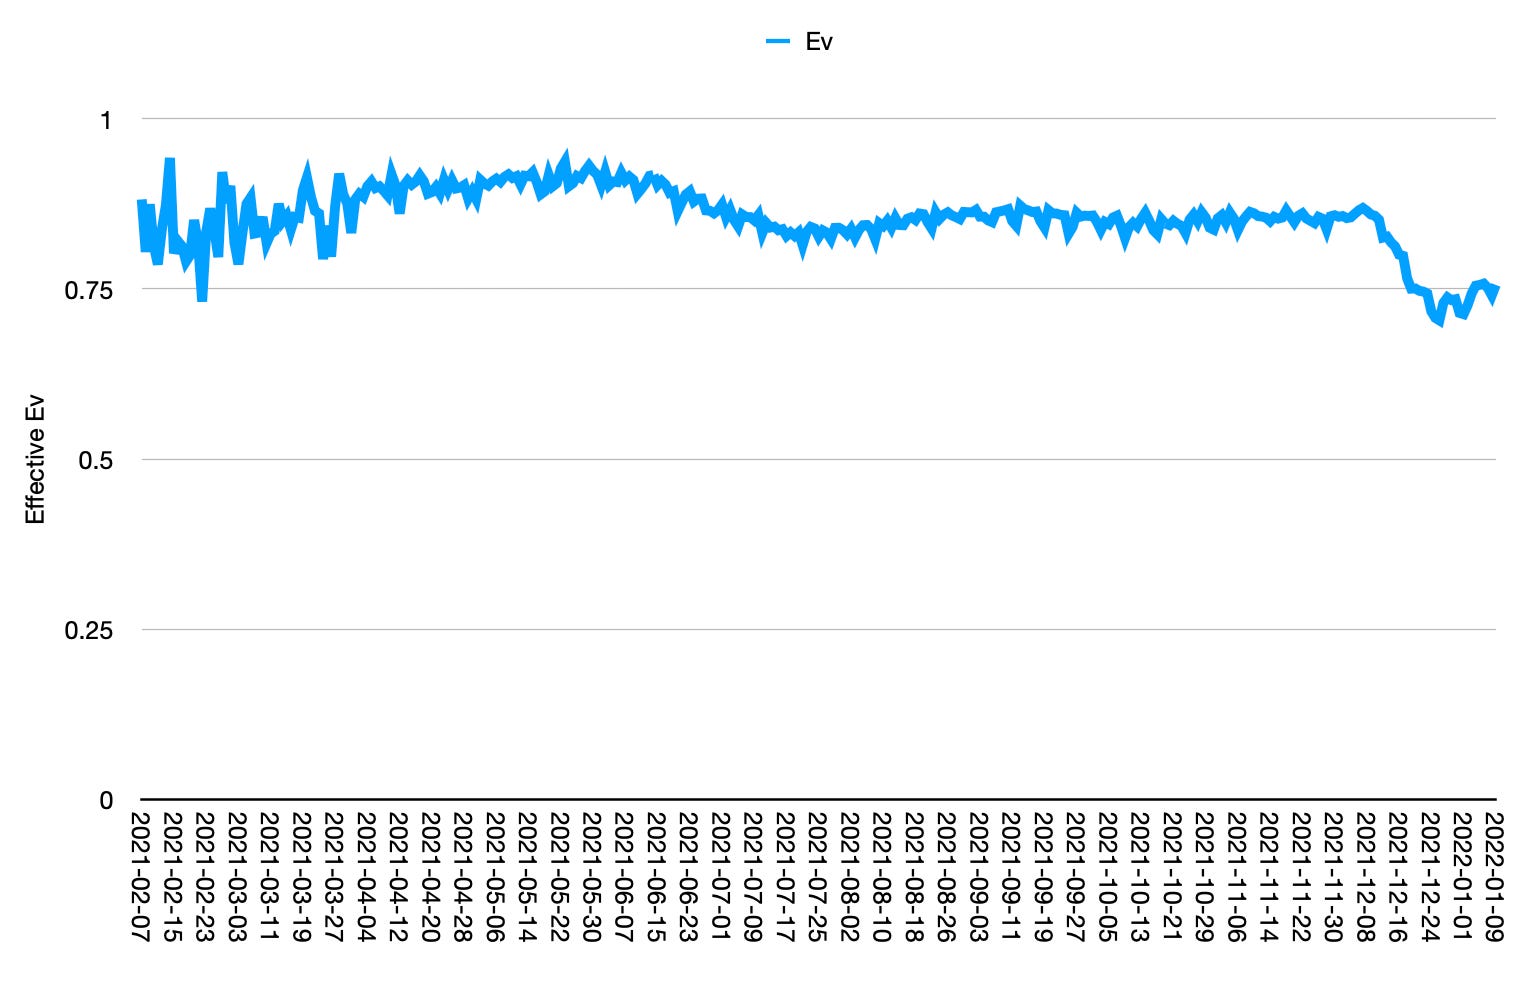
Well thats interesting — this is a much higher curve than I’ve seen from other state’s data. During the summer and fall — where we see the slight dip here, other states show Ev around 60-70%. California looks much better. In omicron — the right side of this plot — we might be seeing it just touch 75%, where Oregon6 and Alaska7 might be approaching zero. Why would it be better in California? Are the vaccines there better quality? Seems from this if you are going to have to get jabbed you probably ought to head out California! Whatever they’re injecting into people there seems to be working out really well.
Another possibility — I’m going to quote Dr Pierre Kory8 from Senator Ron Johnson’s “Second Opinion” workshop from earlier this week (my transcription — apologies):9
You know, this constant refrain that Dr McCullough just pointed out, is that: 'everyone in the hospitals is unvaccinated'. I believe that is manipulated data, and it’s done again for the same purpose that I keep talking about. They want to vaccinate, vaccinate, vaccinate. Every vaccine brings profits. Now. How do they do that. In this country, when you log in to the most popular electronic health record, which is probably EPIC10, and I've been in numbers of hospitals through the pandemic. There's only two statuses a patient can have: They can either be “vaccinated”, or they can be “unknown”. There is no category of "unvaccinated". Its "unknown". And it is my hypothesis, I cannot prove this. I believe if you have been vaccinated within that hospital or hospital system, that vaccination record appears. If you went to a Walgreens or Rite-Aid or some private practice, I think its highly likely it doesn't appear that you are vaccinated. I believe they are artificially, with great purpose, they are hiding the fact that many people in American hospitals are vaccinated, because Dr McCullough just talked about -- why in the United States is the data here completely discordant from other countries and other health systems which ARE revealing the underlying granular public health data in a transparent fashion.
I haven’t gotten into this here, but that places like Europe11 have been seeing precipitous crashes in Ev with omicron is a large part of why I’m scratching at the scraps of data grudgingly made available here in the US, to see if that is happening here.
So what might the effect of something like what Dr Kory suggests be? Well, since I have the case numbers in this spreadsheet, I can make a copy of the thing and try a simple adjustment. I know from Oregon and Utah12 that during the summer and fall, I get an effective vaccine efficacy around 70%. What if I apply a constant factor — which we can maybe think of as a “vaccine attribution inefficiency”, Iv — to the vaccinated and unvaccinated counts in California. I multiply the vaccinated case count by 1+Iv, and subtract the difference out of the unvaccinated count to keep the total unchanged. I don’t change the underlying vaccinated/unvaccinated total population counts, since that comes externally from the numbers of doses applied. We’re hypothesizing that this affects the case counts — that cases are being thrown in the wrong box, not that the boxes themselves are any bigger or smaller.
If I wiggle this Iv, this inefficiency factor, back and forth, I find that I match Oregon reasonably OK at a surprising 40%. Meaning I find that I can get close to matching the numbers from Oregon in September-November by pulling about 40% of the vaccinated case count out of the unvaccinated case population in California’s numbers. What does this look like then?
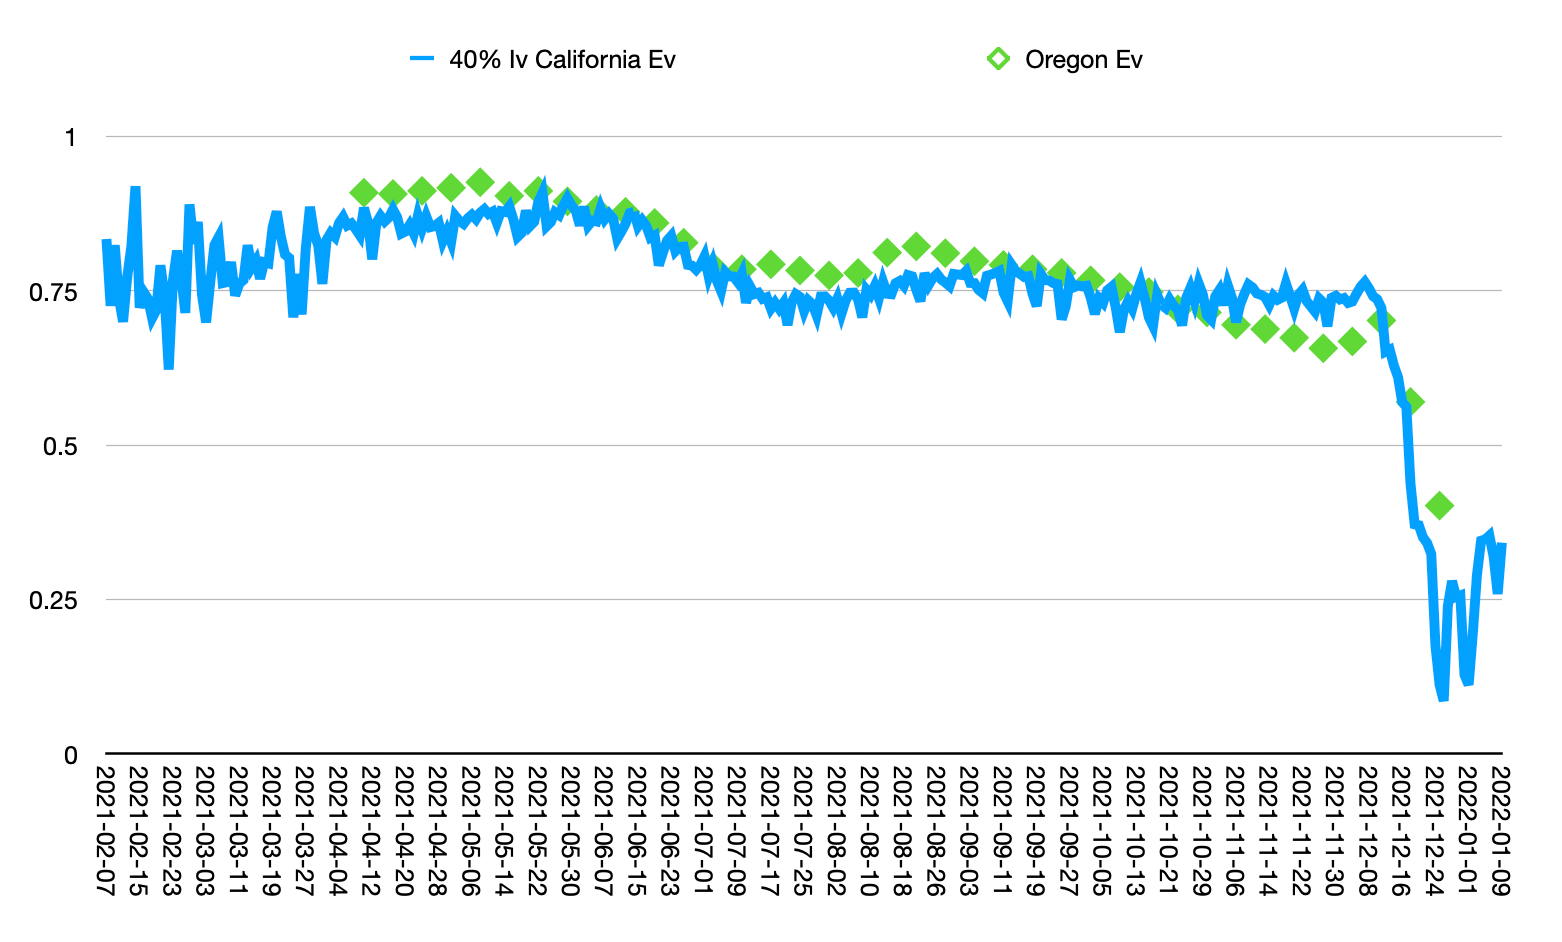
OK — so thats interesting — maybe that kind of effect could get these guys in line? Of course we also could have gone the other way, and shifted Oregon upwards to meet California. To do that there would need to be some mechanism that mis-attributes unvaccinated cases as vaccinated. Could Oregon, Utah — or what would have to be to a worse extent, Alaska, have massive vaccination card fraud? Or, as we suggested earlier, are they getting much less effective vaccines in those states vs California, so some inverse “Californian Vaccine Super Efficacy” factor needs to be taken into account?
I think though I’m seeing a common theme — its a bit like pulling teeth, and I’m really pulling them here with a sledge hammer and chisel — the vaccine efficacy is looking to completely hit the floor in the US too with omicron.
Oh. hey. Georgia. Georgia has some data too looks like…
https://data.chhs.ca.gov/dataset/covid-19-post-vaccination-infection-data
https://covid19.ca.gov/state-dashboard/#postvax-status
https://en.wikipedia.org/wiki/Vaccine_efficacy
https://deepblue.lib.umich.edu/bitstream/handle/2027.42/63672/fruitbat_1.pdf?sequence=1
https://www.pfizer.com/news/press-release/press-release-detail/pfizer-and-biontech-conclude-phase-3-study-covid-19-vaccine


And probably more importantly: https://covid19criticalcare.com/
Quote is from 4:10 or so in (thats 4 hours, 10 minutes). Watch the whole thing: https://rumble.com/vt62y6-covid-19-a-second-opinion.html
My transcription — I’m assuming thats an acronym — I have no idea what that is, but this is what it sounded like he said.