

And Yet There's Oregon 5!
And Yet There's Oregon 5!
As in ALL THE FINGERS!

The virtual convoy is taking a roundabout route to Utah — Oregon is calling again! But before we get there some quick recap:
And Yet There's Oregon 1, 2, 3, and 4
In all of these we’ve been looking at case counts and then breakthrough reports from the State of Oregon. In the latest episode, from a few weeks ago we’ve seen a significant drop, then rebound in vaccine efficacies:
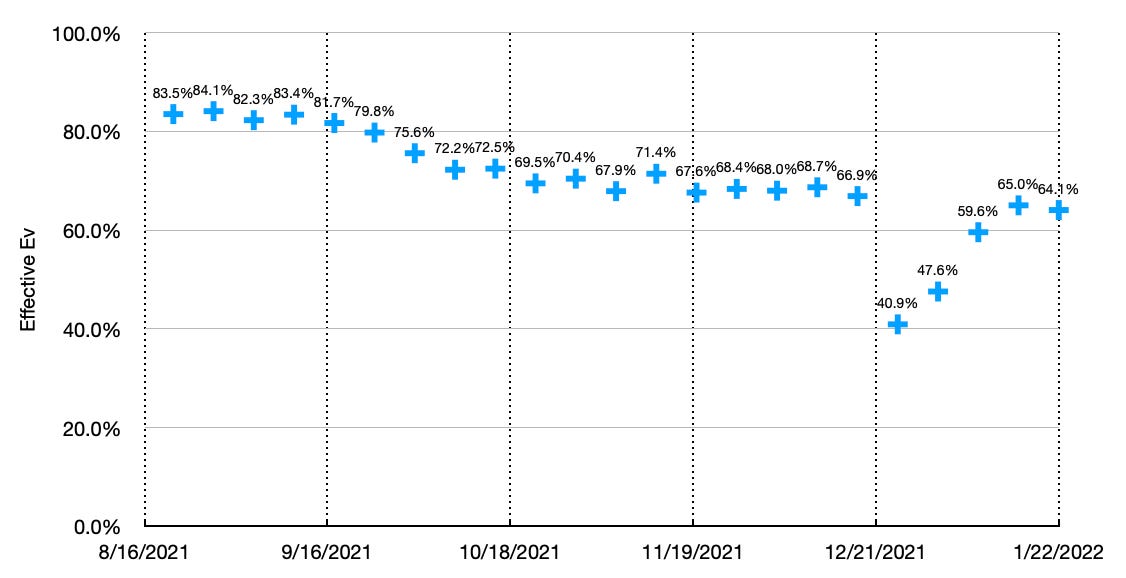
From this we put forth a guess that the zig-zagging came about from reversing vaccinated and unvaccinated counts once they “crossed”. Hypothetically, once there came to be more vaccinated than unvaccinated cases, that they were swapped, due to a human or coded expectation that that should never happen. This could cause an abrupt trend reversal like this.
Later, when looking at Georgia data1, which has similar behavior, we came up with an alternate hypothesis: That omicron could be more infectious in vaccinated people than unvaccinated. If the outbreak proceeded faster and more readily in (at least some of) the vaccinated population, you can see a similar crash in Ev and recovery, as the unvaccinated population “caught up”, and the infections then mixed between the two populations2.
Now the plot thickens. Oregon has released this week’s breakthrough report3, with some interesting updates. In the report, they mention that with the high numbers of infections in the omicron surge, their database has been unable to keep up in determining vaccination status4. As a result approximately one third of the cases have unknown status. Prior to these data, those unknowns have been included with the unvaccinated. In this week’s report however they more correctly call them out:
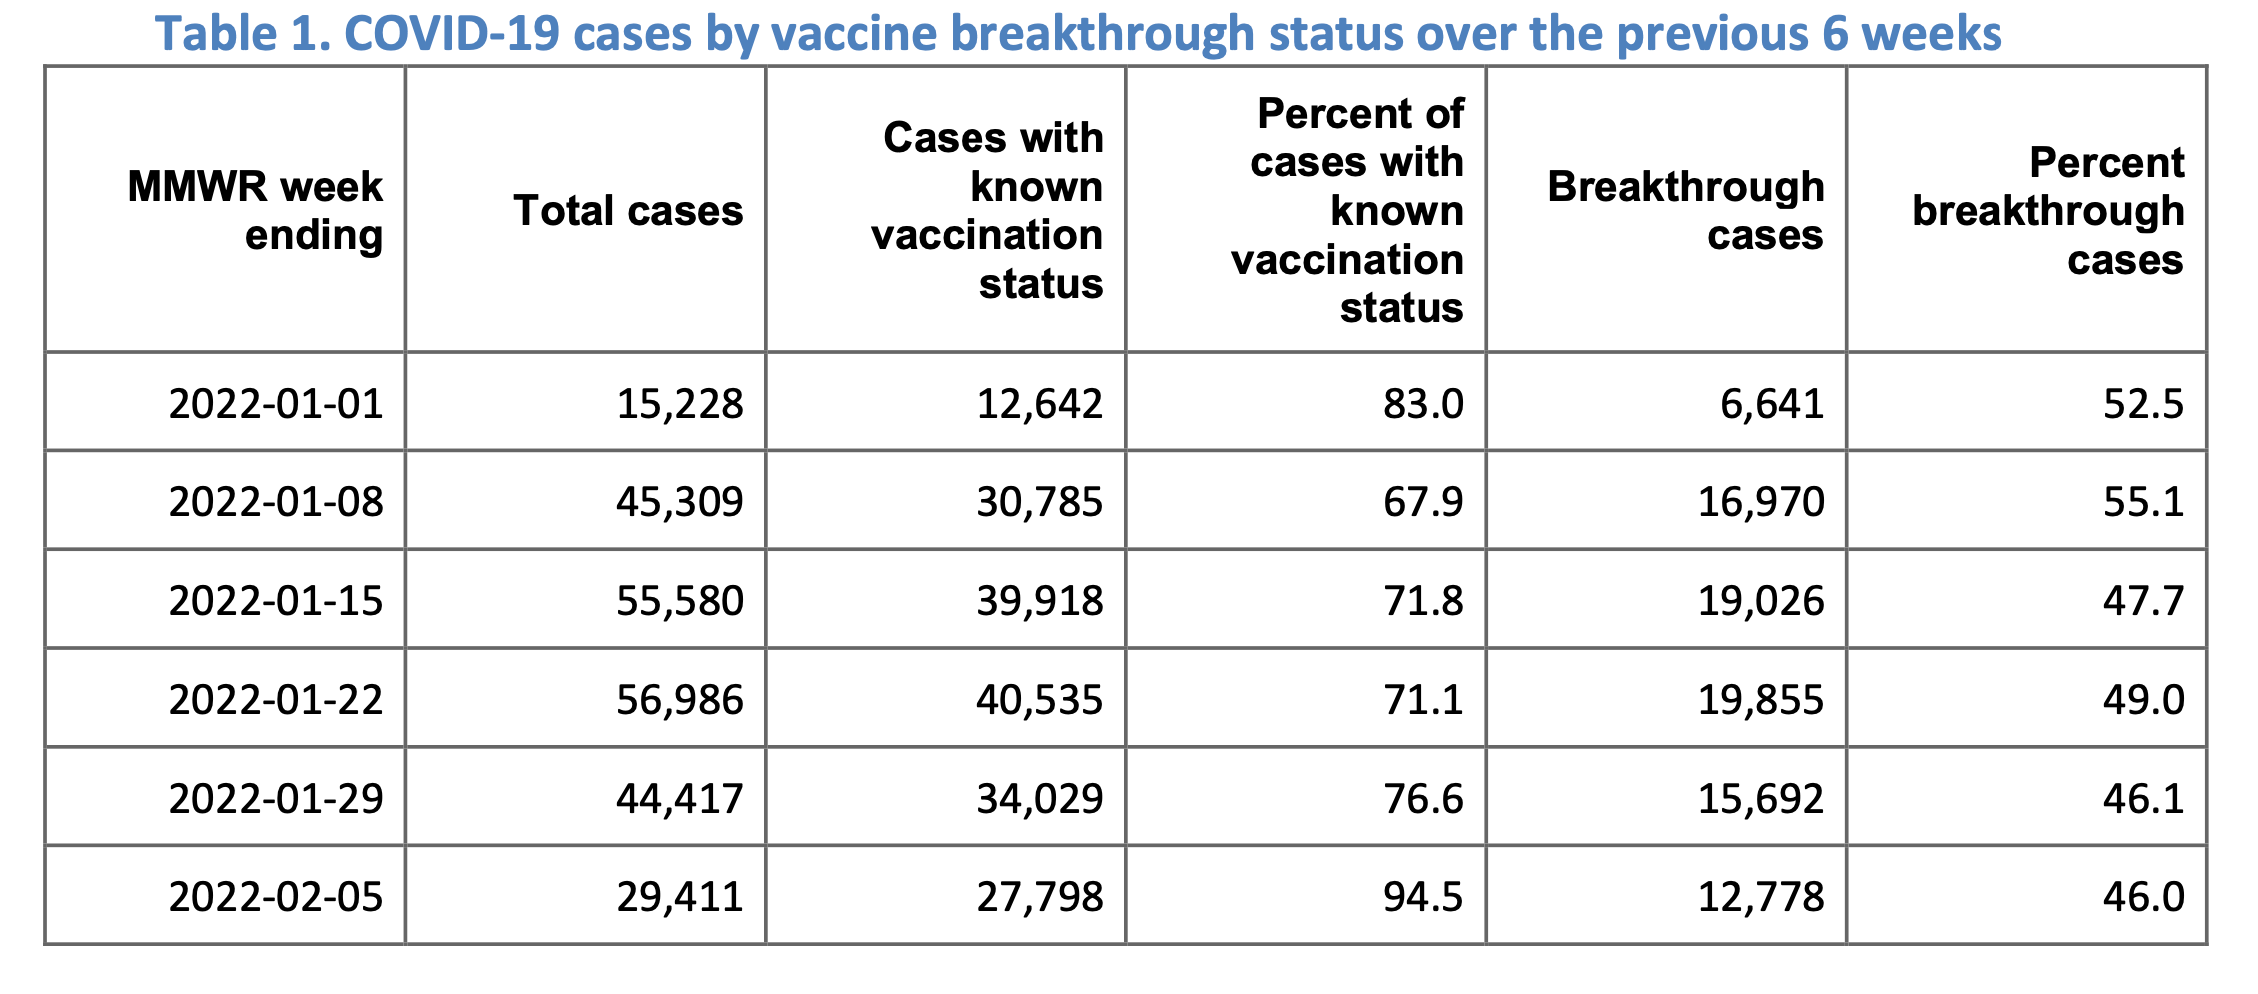
Above is from the Feb 10 report, which now includes columns enumerating the case counts for known and unknown status. Oregon should be applauded for providing this! Bravo! Including the unknown status with unvaccinated is certainly incorrect, and calling them out like this allows us to calculate things like an efficacy (hopefully) more correctly. Also note the right hand column — in early January, there were more vaccinated covid cases than unvaccinated. But be careful — keep in mind that there were and are also more vaccinated people there than unvaccinated.
But let’s then take these numbers and try our efficacy calculation for Oregon again. Here we will compare the original ‘vaccinated vs total’ calculation and the ‘vaccinated vs known’. The latter being more correct — we in this would want to not include the unknown status, since we have no idea what box they belong in. They will be some mix of vaccinated and unvaccinated, and placing them in either box would introduce a bias. So here is the new version:

The breakthrough report only includes the last 6 weeks of data, so there will only be a difference for those last 6 points. The solid curve represents the calculation only on known status cases. That unvaccinated = known - vaccinated (whose status is presumably also “known”). The dotted line continues assuming unvaccinated = total - vaccinated, as was done for all prior points. It would be great if Oregon provided the status known numbers for 2021 as well.
So — clearly when you aren’t over counting your unvaccinated population, the efficacy goes lower. It is interesting that we still see the crash and recovery behavior. One could still imagine — this time instead of 12/25, maybe sometime in the first weeks of January, that the populations crossed and were swapped. But then also as mentioned in earlier, it could be we’re seeing a rebound due to the vaccinated population being hit harder initially, then a recovery with everyone else catching up. Differentiating this again into vaccinated+boosted cases and vaccinated+previous infection cases might help disentangle a question like that.
One thing this does not do yet though is really reconcile these numbers with what we find from other states. California is still high (though the Oregon update now lends support to our guess why it is high5), Alaska is low6 (but then it’s from “age corrected” numbers, not entirely sure what that does), and other states wiggle around in other ways.
And not to be outdone, Utah it appears does its dance as well.
We’ll get there soon.
Assuming I can sneak the laptop with me into the basement I’m supposed to be cleaning up this weekend…

https://www.oregon.gov/oha/covid19/Documents/DataReports/Breakthrough-Case-Report.pdf
Also stashed here: https://web.archive.org/web/20220211012734/https://www.oregon.gov/oha/covid19/Documents/DataReports/Breakthrough-Case-Report.pdf
Though honestly yes we’re talking about tens of thousands of cases, but ~50k in a week? Thats 50k queries in a period of 60*60*24*7 = 600k seconds. Thats 12 seconds per query. If they’re only getting 60-70% back, that means their “are they vaccinated” query must take maybe 20 seconds. They need to hire themselves a better DBA.