

And Yet There's Oregon 4
And Yet There's Oregon 4
Fortunately, there is a place in Oregon called Zigzag.

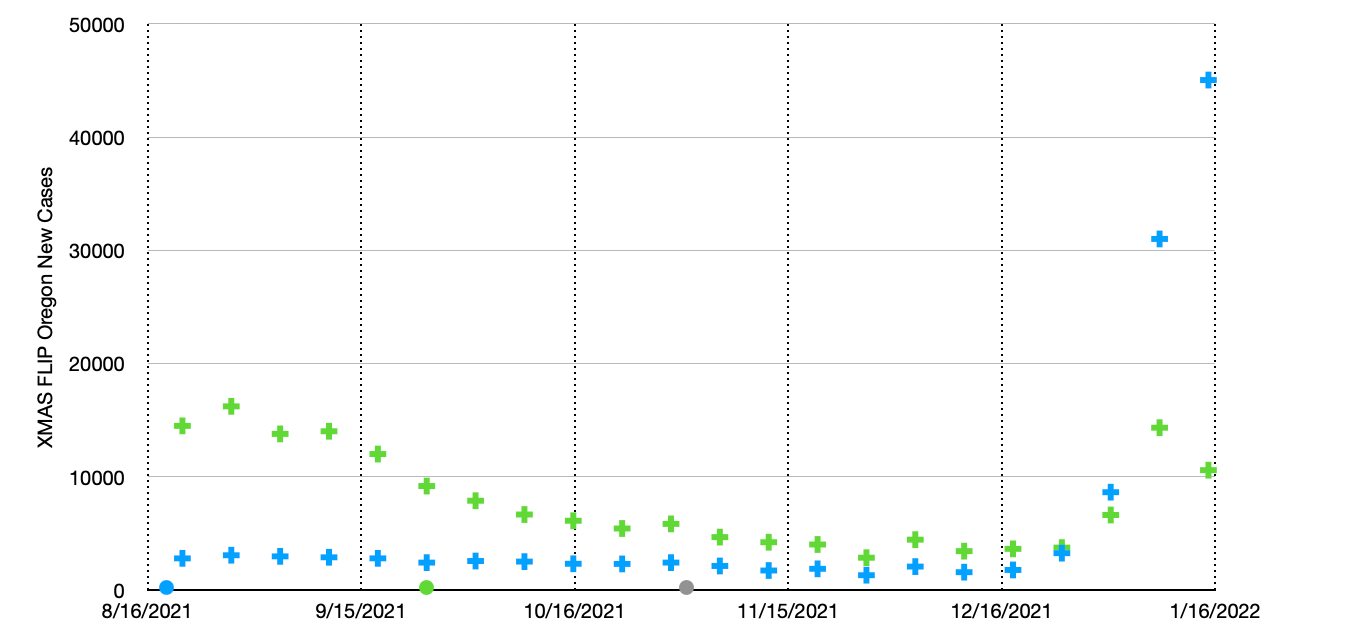
I’ve been wanting to revisit looking at breakthrough reports again1, especially in light of omicron, boosting and all that. I’m returning to Oregon first, since they have been providing very nice breakthrough reports each week for many months. I’ve been squirreling them away, dutifully copying over the numbers into a spreadsheet. This week I finally made time to take a look at them. The case counts for the last few months are below:

Green crosses are cases identified as “unvaccinated”, blue from those identified as “vaccinated”. You can see the peak in August/September and then slow tail from the delta outbreak, and the explosion that is omicron kicking off in the last few weeks. As I’ve done in my earlier posts on this, I want to see what happens when I take these numbers and turn them into a sort of effective vaccine efficacy. I.e. plugging them into:
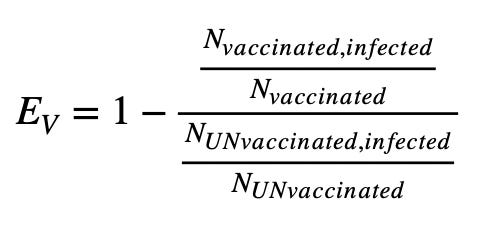
I call this “effective”, since these are real live populations of people wandering around and doing all the varied things people do. In principle this should work only if you’ve controlled your respective populations to not have other differences, “confounders” that might do or anti-do the thing you are trying to measure the efficacy of. Keep in mind that the original vaccine trials also did not incarcerate their subjects though. Sorry — I should not be giving anyone ideas here.
So OK — above would be my “infected” numbers, the numerators of each half of the fraction, then I need the relative populations of vaccinated and unvaccinated. Oregon provides this2:

Oregon has been slowly, incrementally over the last several months approaching 75% of its population completely vaccinated. From October, that group has been getting boosters following a schedule based on when their original shots were. So you would expect to see the green “boosted” curve here sort of an offset replication of the blue/yellow curves. Over half the vaccinated in Oregon are also boosted at this point. I should note there is no boosted category in the breakthrough reports that I can find. Presumably they’re still just counted as vaccinated.
Alright. Numbers in hand, now lets see what this EV looks like over time:

Huh.
OK until December this looks like it makes some sense — we know there has been a degradation in vaccine efficacy associated with Delta. This has been one of the primary arguments for boosters. But for some reason the week before Christmas, just at the head of the current omicron outbreak, vaccine efficacy crashed. And then suddenly over the last 3 weeks, improved, more than doubling the efficacy it crashed to, to better levels than was seen pre-delta? By what mechanism? Boosters save the day?
Scroll up and look again at the vaccine percentage plot with the boosters. The booster ramp-up there begins in the beginning of October. In my efficacy plot above that corresponds to if anything, a slight decline in efficacy, which is maintained until the crash in December. From October to the crash, during this decline, boosters ramped from zero to probably about 30% of the Oregon population. I am not really seeing it as plausible that the boosted, which in the last 4 weeks added maybe another 10% to their ranks, can explain a sudden and complete recovery of 45% efficacy.
So OK — last 4 weeks. What happened in the last 4 weeks in Oregon (well also everywhere else)3:

Last 4 weeks are the last 4 bars in this plot. Omicron4. Omicron hits right before Christmas, and vaccine efficacy tanks. We know this is the case, from all the frantic reporting we have seen about the hyper spreading variant5.
But in Oregon vaccine efficacy bounced. In Oregon some fantastic something saved the day, and deflected the initial assault on all those millions of poor vaccinated people, and not only that, but recovered back to original vaccine glory of early summer!
Or did it? Look closely at the first plot up top. On Christmas Day, 4th point from the right, the vaccinated and unvaccinated cases meet. That is the 40% vaccine efficacy day. The bottoming out in my efficacy plot. What if that wasn’t the point they “bounced” off each other. What if that was the point they crossed each other? Lets try that — lets assume they had crossed, and imagine that somebody innocently looked at the data (or for that matter I’ve seen software bugs that do this), shrugged, said “that can’t be right” and reversed them. What if for the last 3 weeks the vaccinated and unvaccinated counts have been flipped, because it just didn’t make sense for more vaccinated people to be getting covid.
Except though maybe if it does. If you get a variant coming in that the world acknowledges6 doesn’t seem to care too much about whether you’re vaccinated or not, and you actually just have more vaccinated people than unvaccinated (like 75%), its sort of axiomatic that you’d have more vaccinated people coming up positive.
So here’s what my first plot would look like if you just do the simple thing, and “correct” for an accidental flip of unvaccinated and vaccinated counts in the last 3 weeks, after they met on Christmas:
Could this be what really happened? I see at that last point roughly 3x the number of blue, vaccinated, cases here than green, unvaccinated, roughly matching the relative populations. Interestingly, we might even then be seeing a downturn already among my “flipped” unvaccinated population. Many of whom had delta, or alpha or earlier variants already this summer. So OK — now what does my efficacy plot look like if I follow this through:

Nice smooth crash into horribly negative vaccine efficacy. Someone maybe ought to get a hold of Oregon Health Authority & see what’s really going on there?
And maybe think again what we’re all doing here?

https://public.tableau.com/app/profile/oregon.health.authority.covid.19/viz/OregonCOVID-19VaccineEffortMetrics/StatewideProgress
https://public.tableau.com/app/profile/oregon.health.authority.covid.19/viz/GISAIDVariantDashboardUpdated/LineagePrevalenceovertime
https://www.pdxmonthly.com/news-and-city-life/2022/01/omicron-oregon-peak-poop-wastewater-portland. YES OREGON. THEY ARE LOOKING AT YOUR POO.
https://www.oregonlive.com/coronavirus/2022/01/single-day-coronavirus-record-set-at-10947-cases-more-than-1000-hospitalized.html
https://www.cnn.com/2022/01/11/health/us-coronavirus-tuesday/index.html