

And Yet There's Oregon 2
And Yet There's Oregon 2

This is the second of two parts — hopefully by the time I post this I will remember to place a reference to the first part here. (Oh look I did!) As I said in the last bit the intent was all one post, but apparently I’m too verbose for substack. OK. Here we go. Again.
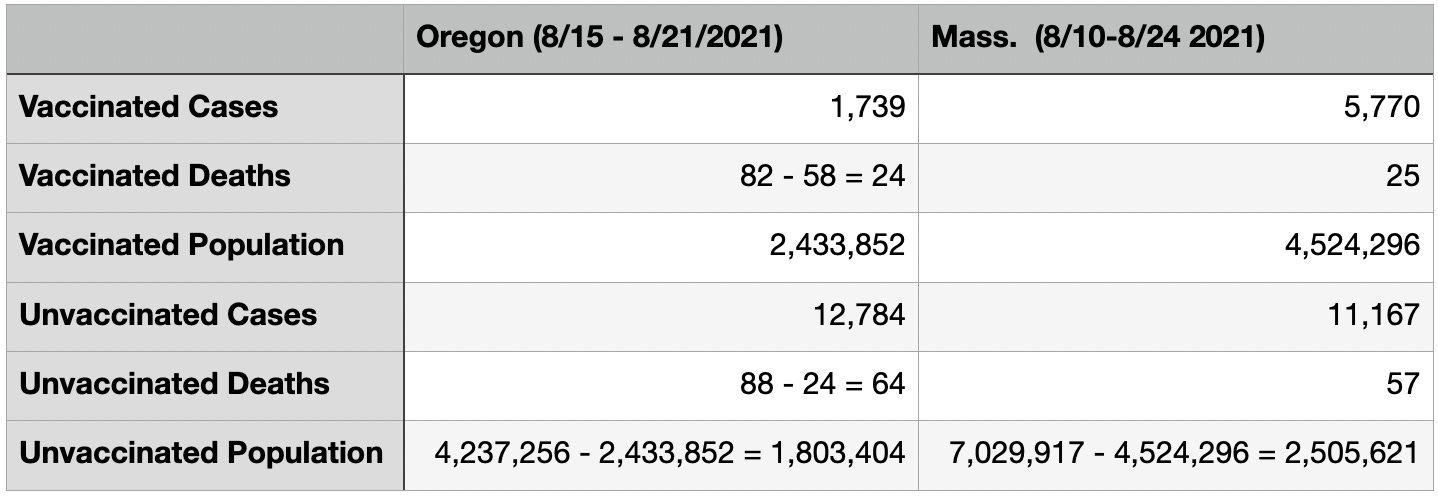
Bringing back over our comparison of some vaccinated and unvaccinated case numbers between Oregon and Massachusetts from Part 1 (ref’s there):
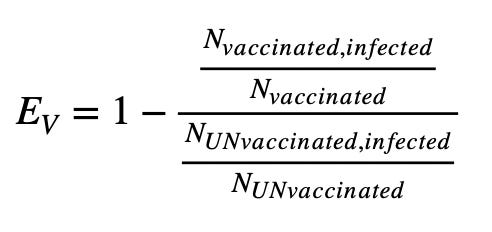
I wanted to try to calculate a "vaccine efficacy"1 from each of these numbers. This is the number quoted for the vaccines to illustrate how effective they are. The numbers you often hear quoted are derived from their clinical trials, which are sort of controlled but maybe not really. They also apparently let their test subjects wander off and do people-y things, much like the ones in these two states. The efficacy is based on the relative risk of contracting a disease between a vaccinated group and a control (i.e. unvaccinated) group. Calculating this from a "live" sample probably isn't quite kosher, but I would think you can come close to reproducing a high efficacy number if the vaccines were as effective as they were in the trials a year ago. Defining it:

EV (Chrissakes substack!!! subscripts?) is the vaccine efficacy, and is expressed as a percentage. RR is the "relative risk". It’s a ratio of ratios -- the ratio of the vaccinated population that gets the disease to the ratio of unvaccinated that gets the disease. You are subtracting from 1, because you want to find the left over “safe” number, where RR is the “risked” fraction. So in this case would look like this:
For Oregon this would be:
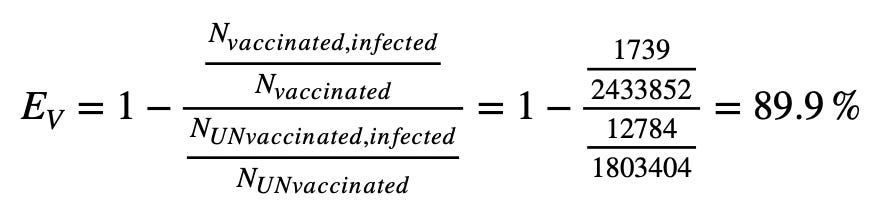
So this is interesting -- we might be seeing near ideal efficacy of the vaccine in preventing cases in Oregon! What about Massachusetts?
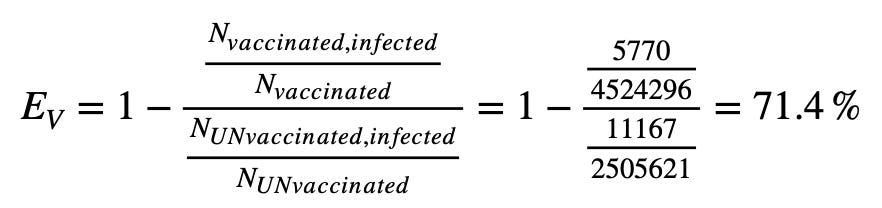
Massachusetts somehow sees some degradation in vaccine performance during the two weeks our data is from. Oregon seemingly does not (I tell you its the no sales tax). Is something different between what the two are seeing? Maybe different variants are at play? In Oregon it appears during the week in question almost all the variants sequenced were the Delta variant2. According to the CDC this was also the case for Massachusetts3. Both have Delta variant fractions 99% or higher. Delta is all thats going on now. I guess cross that explanation off the list.
Maybe the times people were vaccinated in the states have something to do with this -- what if in general people in Oregon were vaccinated more recently than those in Massachusetts? If the vaccines become less effective over time this could make a difference (and point to boosters). Well we don't have the vaccination status of individual cases over time, so can't really say if the ones that died were people who got their shots earlier. You can suppose generally though by looking at the vaccinations over time plots4:
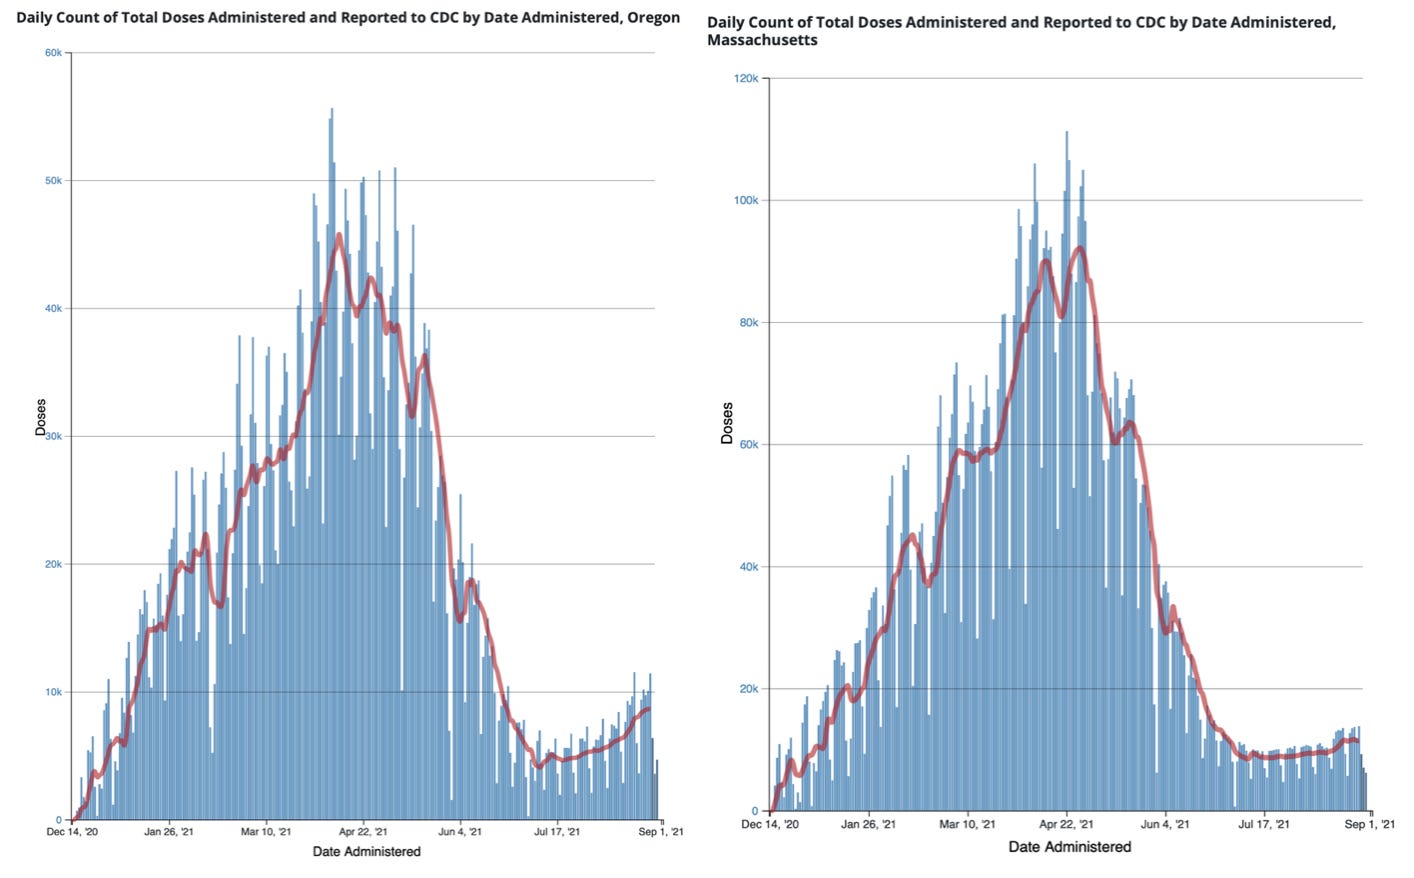
These look fairly similar, Oregon on the left, Massachusetts on the right. Maybe some hint of Oregon actually having a bit of a hump earlier on in the distribution, but then also ramping up a bit recently. In fact though, beyond the visuals, one can calculate the mean vaccination time for each of these distributions. We pull down the csv, drop into pandas, jupyter, and whirr… clunk. out fall weighted averages. In terms of week of the year (because it’s a number, so easy for lazy people to average), for Oregon this comes out to be week 16.31, and Massachusetts 16.42. So on average people in the two states have vaccination dates equally far away from today5. So broad brush, a difference in time people completed their shot sequence in the two states wouldn't seem to explain why Oregon reports better vaccine effectiveness.
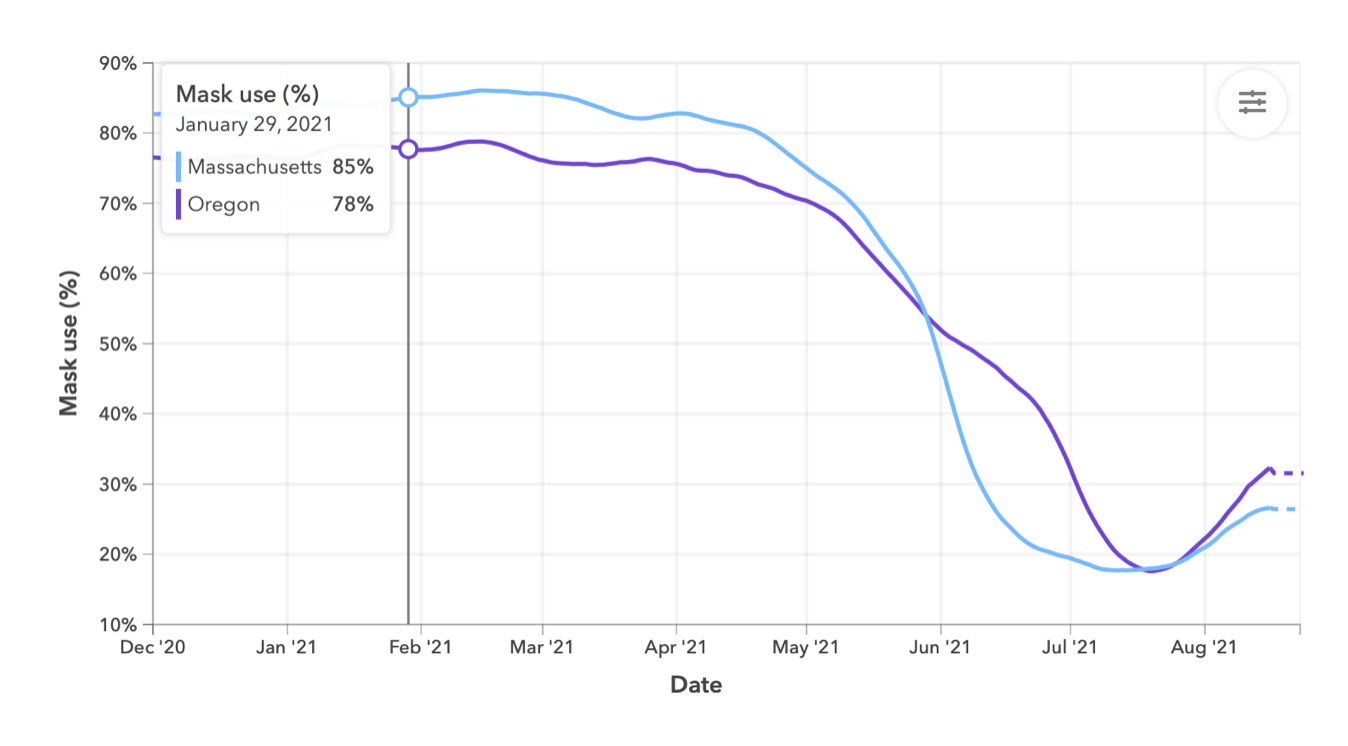
Could Oregon be doing a better job keeping masks on people? I mean now apparently they’re making people wear them outdoors.6 The University of Washington’s IHME7 has been modeling the pandemic and providing very nice graphs of what those models predict in coming months8. Included in their model is an estimate of mask use within the countries. I expect it is really difficult to actually determine mask adoption, and further whether worn masks are effective (i.e. a slapped on bandana because the user is forced to put something on their face they don’t realize might help them would have doubtful effectiveness). But can perhaps give a hint.
Below is a plot of the estimate of mask use for Oregon and Massachusetts over time. Like most places in the US, after May 13,9 both vaccinated and unvaccinated ditched their masks. Both states drop from 80-90% "usage" to below 20% by mid July. Note this in principle is 20% of the whole population, which is why I said "vaccinated AND unvaccinated" earlier. You in shouldn't be able to get below your unvaccinated population -- i.e. around 40% if its only the vaccinated doffing the masks. Also MA seemed to be more enthusiastic than Oregon, with an almost vertical drop in the mask plot by June. There is perhaps a period, if these represent what people are doing at all, that more Oregonians would be wearing masks than Massachusettsians (or whatever they're called) were. Could that explain why more vaccinated people have been getting infected there? If so we REALLY need to be hyper vigilant about mask use.
There could also though be other biases in this data. Until an August 2 update10, the CDC recommendation was that vaccinated people "with no COVID-19 symptoms do not need to be tested following an exposure to someone with COVID-19."11 Employers, also for example, generally only require regular covid testing of unvaccinated employees (those that still have unvaccinated employees). This could, and likely does, mean that the vaccinated population has inconsistent reporting, which means inconsistent knowledge of breakthrough cases. The "testing pressure" is lower for the vaccinated class, so there is an inherent bias against observing the breakthrough cases, at least those that are asymptomatic or mild. Oregon could be looking like vaccines have the ideal efficacy because an unknown number of vaccinated cases there are going unreported, where this is not the case for the unvaccinated rabble.
There are things that are hard to be fuzzy about though, and one is whether people died or not. Though fortunately the numbers are small, we've already observed there seem to be some inconsistencies between cases and deaths in the two states in part 1. Let’s see how things shape up there. Below is a repeat of parts of the case, death numbers table earlier, but with columns added for the death/case ratios for each infected population.12

Certainly since this is counting people dying, we're fortunate to be looking at low statistics. But with low statistics comes higher relative uncertainties when you try to compare them, which here are in the 20% ballpark (at least)13. The death/case rates though are completely consistent for both vaccinated and unvaccinated populations in Massachusetts, and those with the unvaccinated cases in Oregon.
The death rate seems to be 3x higher for vaccinated people in Oregon however. That either means the 90% efficacy we calculated is right, and something in the vaccines is causing 3x the number of vaccinated covid sufferers to die, or the chance of dying is similar (as seems to be the case in Massachusetts) between unvaccinated and vaccinated, and we just don't know what the breakthrough situation is in Oregon.
If the Oregon case/death rate were in the 0.5% range, there should have been something like 4500 breakthrough cases there during this period. This would change Oregon's EV from 90% to be about 74%. We calculated 71% for Massachusetts. I am struggling to find a good argument why the other 3 ratios could be too low.
So where does this seem to leave us?
From part 1 we might understand what the Oregon breakthrough time-series plot is plotting, but would help if they actually explained it. Although:
It looks like Oregon might be under-reporting breakthrough cases, if deaths are any indication, by a factor of 3. Though they probably can have their unvaccinated curve reach up to about 700 in that plot, the unvaccinated curve probably ought to be reaching up near 300 in that plot. Ah. No. The 700 probably comes down, since some of them move into the vaccinated population. In fact their unvaccinated curve may accidentally be about right there, but the grey curve probably starts to come up to meet it now. The current outbreak there I would say is not accurately characterized as a “pandemic of the unvaccinated”, and portraying it as such very much buries the lead I think.
We still do not see evidence that vaccines reduce one's chance of death having caught COVID. If Oregon's efficacy numbers hold up for some reason, we instead see hints that they might actually reduce your chance of survival after infection. (don't read too much into that last statement -- it can only be said I think if you insist the vaccines are fully effective. I don’t believe they are, and say that to mostly point out the absurdity of the statement that they are still fully effective).
The vaccines do seem to still do something now, though efficacy might be more in the 70% range than 90% range. The previous point then becomes much more important. If the vaccines in fact do not improve the severity of the disease, its not clear what benefit they offer as the efficacy degrades further. Which is inevitable unless we embark on a continuous regular update of variants finding better cracks in the armor to squeak into.
I think what we’re seeing here (and elsewhere) is that the effectiveness of covid vaccines are, as one would expect14, degrading over time. Lets think pre-covid for a second. All of us have at some point had to take antibiotics for one thing or another. We all know at this point that although still pretty liberally used, (and in fact because too liberally used) many antibiotics have become less effective due to antibiotic resistant strains of diseases emerging. As a result, doctors are supposed to diagnose a true need for an antibiotic before prescribing one — knowing the more its used, the more likely we will lose that tool’s effectiveness against future pathogens.
It is inevitable that the rapidly reproducing and changing things that infect us shift and evolve versions possessing an advantage that allows them to increase their numbers within a formerly unavailable population. Many more without an advantage also emerge, but fade away in favor of the ones with access to the wider population. Delta is probably everywhere because it appears to have some foothold on the vaccinated population in addition the the unvaccinated population. And on top of that, this newly accessible vaccinated population have been told they’re free to abandon all precautions against it.
I think we are seeing the promised shield of vaccination crumbling, and somehow have also constructed policies and encouraged human tribal tendencies to make it hard to understand by how much. We probably need to be treating vaccines much like we have come to treat antibiotics. That there are significant breakthrough cases likely occurring now breaks apart the herd immunity argument for widespread application completely. Instead of liberally spreading vaccines across the world, encouraging the emergence of variants that dull or break their utility for the most vulnerable of us, we need to be holding them close, only applying them where necessary. We have already (sort of) learned we need to do this with antibiotics. It is not the unvaccinated that are jeopardizing our most vulnerable who have so far been somewhat protected by the vaccines, but most likely the contrary.
Oh. And the vaccines are effective.
https://en.wikipedia.org/wiki/Vaccine_efficacy
https://public.tableau.com/app/profile/oregon.health.authority.covid.19/viz/GISAIDVariantDashboardUpdated/LineagePrevalenceovertime
https://covid.cdc.gov/covid-data-tracker/#variant-proportions
https://covid.cdc.gov/covid-data-tracker/#vaccination-trends
Yes OK my data though is roughly a week from each other. If a ~week difference gains complete efficacy I think we’re pretty screwed.
https://govstatus.egov.com/or-oha-face-coverings
https://covid19.healthdata.org/united-states-of-america/oregon?view=mask-use&tab=compare
OK, I can’t resist here — in early 2021 I think, when we finally got to a place where China let us buy masks from them again, we started the push to mask up. At this time IHME added this mask component to their modelling. Very clearly showed with their modeling the effect of masking and the dire predictions from not masking. They’ve never though done this for vaccines. I’ve never understood this, given the enthusiasm for vaccination. Why?
https://www.whitehouse.gov/briefing-room/speeches-remarks/2021/05/13/remarks-by-president-biden-on-the-covid-19-response-and-the-vaccination-program-3/
https://www.cdc.gov/coronavirus/2019-ncov/symptoms-testing/testing.html
http://web.archive.org/web/20210729005421/https://www.cdc.gov/coronavirus/2019-ncov/symptoms-testing/testing.html
Something I should point out here, is there is some weirdness in what I’m doing, in that deaths now aren’t resulting from cases now, but from cases some number of weeks ago. I should probably be doing these ratios of deaths vs something like two week prior case numbers, but given I’ve had to chase some of these by finding archived news articles, its not so straightforward to do. At least I am being consistent in having the same two week-ish difference with both Oregon and MA. Have I said it would be nice to have a public correlated case/vax dataset to do this properly?
Completely glossing over differences in age distributions, localized outbreaks, any outbreak in a shared living situation can blow these numbers out of whack…
Imperfect Vaccination Can Enhance the Transmission of Highly Virulent Pathogens
Read AF, Baigent SJ, Powers C, Kgosana LB, Blackwell L, et al. (2015) Imperfect Vaccination Can Enhance the Transmission of Highly Virulent Pathogens. PLOS Biology 13(7): e1002198. https://doi.org/10.1371/journal.pbio.1002198