

And More VAERSy Doats and Dozy Doats
And More VAERSy Doats and Dozy Doats
And a little Calibration!

…And now we’re back. I should remember to refer to the first bit of this here:
But actually that then refers to this.
It’s really turtles all the way down.
So I spent some time virtually wandering across the country in search of vaccine breakthrough data to compare what I’m coming up with in VAERS. It is not easy to come by necessarily — many states, but fortunately not most, have not made this data available anywhere I can find. I did manage to find 30 states that do however, each reporting vaccine breakthrough data in various machine-incompatible ways up through dates ranging from September-December1. There’s some further data mining needed in what I found, especially updating past observations I’ve made of Massachusetts2, Oregon3, and Utah4. For each of these 30 states, I retrieved and counted up my breakthrough filtered numbers in VAERS, up to the date they last reported.
Even this is fairly messy, as there are a large number of entries in VAERS missing data in the STATE column (but with plenty of information in other fields). I actually wonder to what extent this is intentional for medical data privacy reasons. Among my 3322 entries flagged as breakthrough fatalities, only 2420 have the STATE column populated. This is a number we will need be aware of while working with this data as a function of state.
For the states that I have external breakthrough data and the states are identified in VAERS, the VAERS numbers are below:

The plot is of the number of VAERS reported fatalities for each reported state that I’ve flagged as a breakthrough entry — the numerical value of each datapoint is printed above each “x” in the plot. These are totals for the year 2021 up to December 10 at the latest, the last day I have VAERS data for. For many of these states I only have their reported totals up to a certain date, as early as the end of September. I totaled that state’s VAERS numbers to the same date above to try to remain consistent.
The extracted VAERS numbers are mostly quite low — here is what I get from the public reporting I’ve dug up in each of these states:

The values for each state here seem to be quite a bit larger than what we’re getting out of the VAERS database. None of the state reported numbers are below the VAERS numbers. This implies not all the state data is making it into VAERS5. Lets take the ratio — VAERS number / state number:
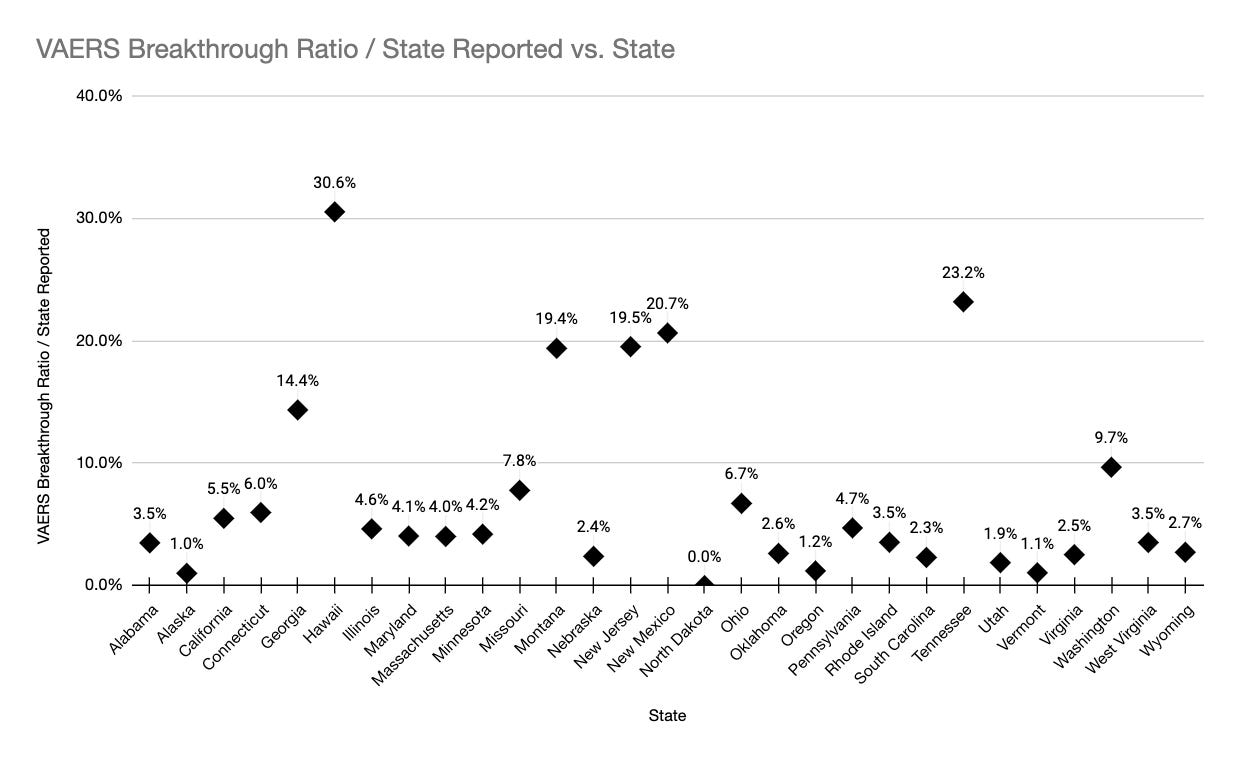
So here the ratios are represented as percentages. You can read this as for each of these states, that percentage of their vaccine breakthrough data is entered into the VAERS database and identified for that state. You can think of it as a kind of “breakthrough reporting efficiency”6. A lot of the points are sitting around 3-4% VAERS breakthrough reporting rate. Hawaii is the winner with 30%. The population weighted average over all the 30 states that reported breakthrough externally to VAERS, and the state was identified in VAERS, is about 7%7. This says that about only 7% of the US covid-19 vaccine breakthrough deaths end up being reported in the VAERS database, with the state identified. Reminder: there is an apparent legal reporting requirement for states to report vaccine breakthrough in VAERS8.
One thing we can try with this number is make a prediction what the overall breakthrough death number is for the states that do not report the number externally to VAERS. Use this 7% reporting efficiency number to scale up the numbers reported in VAERS to estimate the “missing” breakthrough death numbers those states don’t report. Taken all together, I find the 20 states that did not have external breakthrough fatalities reported add up to 1465 fatalities found in VAERS. 1465 / 7% is nearly 21,000. So from this I suppose I can estimate there have been approximately 14,300 (from reporting states) + 21,000 (from non-reporting states) = 35,300 vaccine breakthrough fatalities in the US in 2021 so far.
My 7% was calculated based on the number of reported breakthrough deaths in the states that make that data publicly available. If those numbers themselves were under-reports, whatever that factor is moves this 7% downwards. The efficiency goes down because there were more breakthrough deaths that we don’t have external record of, and are therefore are not accounting for. One reason for this can be, for example, that states for which the vaccination condition of the patient is unknown do not count those deaths in the breakthrough category. If this 7% goes downwards, the estimate of the true number of vaccine breakthrough fatalities then goes upwards. Going back and revisiting breakthrough reporting rates is something I need to look at now that I have some of these numbers.
This also seems like a good place to emphasize that this 7% applies to the entries “with STATE column filled” as opposed to “reported in VAERS”. There are quite a few more death entries in the database that did not have the state indicated. If you assume the same distribution in the non reported states as for the reported ones, to get the “reported in VAERS” number you can scale by the total/reported ratio (recall 2nd paragraph at top). This is 3322/2470 = 1.34. That moves my efficiency number up to 9.4%. In round numbers I think I can say “10% of the State locally reported COVID19 vaccine breakthrough deaths are reported in VAERS”9.
You can try to make a further leap here, which is mainly where I was headed in the first place. IF you assume the reporting efficiency is the same between breakthrough deaths and vaccine injury deaths, you can try to estimate an “under-report corrected” fatality due to vaccine injury number (with the VAERS causality warnings and all that). I have 5876 US fatalities that I have not flagged as breakthrough in my VAERS data. If the 10% breakthrough reporting efficiency number can be used here, that ought to be more like 58,000.
When I stumbled into it, I was actually surprised breakthrough numbers were to be reported into VAERS — From the acronym its clear its supposed to be for vaccine adverse events, but not clear that breakthrough “failures of the vaccine” also go in here. It could be that potential reporters are also unaware of this for breakthrough events in particular, which would lead to a lower reporting efficiency than would be the case for the more direct vaccine adverse events. So that could mean a better (higher) efficiency than my 10% should be used to estimate a true number for the injury data.
Then there is the extensive work to get at this by Steve Kirsch10, Jessica Rose11 and Mathew Crawford12.13 There they use anaphylactic reaction numbers from the CDC to try to measure this, and get a 41x under-report factor, or a 2.5% efficiency. This would give me a mind boggling 41 * 5876 = 241k vaccine injury fatality estimate.
If the 241k number vaccine injury number is correct, it could that mean that breakthrough numbers are 4x better reported than vaccine injury events in VAERS. (seems backwards, but could be?) Does this mean a breakthrough reporting efficiency has nothing to do with a vaccine injury efficiency (could be)? Does it mean the reporting efficiency is similar, but there is a ~x4 under-report on the state side for vaccine breakthrough deaths (most of the states are in the 3-4% efficiency range — could be)? Is the Steve Kirsch “41x” number too high (could be, but they appear to have done a lot of cross checks and likely took/are taking many arrows defending that number). Lots of uncertainties in this game (certainly for what I’m doing). Note I have not even attempted to quantify those (yet).
Ah crap. Substack says this is too long for email now. OK screw it — plough forward!
OK — where does all this leave us. I should take stock.
There appears to be quite a few covid breakthrough infection events also reported in the VAERS data
My nonexpert reading of the rest convinces me they’re mostly vaccine caused.
From the VAERS vaccine breakthrough data vs what states externally report, I get an average of about 10% reporting efficiency, but this ranges from 2-30% depending on state. That means the VAERS numbers there are on average 10x (or more or less depending on the state) too low.
I cannot directly make this comparison for 20 states due to no public breakthrough fatality reporting that I’ve been able to find.
I can use the public breakthrough fatality data from 30 states to get an estimate of the total breakthrough deaths, which ends up somewhere around 35k.
If I extrapolate that to the vaccine injury selection I have, I estimate about 58k total vaccine injury deaths.
This is quite a bit lower than one gets with the 41x factor — which if I apply to my injury/breakthrough selected number gives me around 241k vaccine injury deaths.
Uncertainty on these numbers is
likelyhuge.
Upshot is, I think I’m very much inclined at this point to believe VAERS numbers quoted are too low if taken on their face (though also need to be adjusted for breakthroughs that also live in there). Whether we’re looking at 55k, 241k deaths, or somewhere in between, these are huge, huge numbers. How does this compare to the actual death rate from the disease? Is it better or worse given many disease deaths may have been mis-attributed to covid14?
Oh. And obviously little lamzy divy.
This is a sorta long list, but really should be 50 long rather than 30…. I was really tempted to make each one its own footnote to scale test substack’s footnote implementation…
https://dhss.alaska.gov/dph/epi/id/siteassets/pages/HumanCoV/COVID_monthly_update.pdf
https://portal.ct.gov/-/media/Coronavirus/CTDPHCOVID19summary11182021.pdf
https://breakthroughreports.s3.amazonaws.com/Breakthrough+Report_211130.html#summary
https://dph.illinois.gov/covid19/vaccine/vaccine-breakthrough.html
https://coronavirus.maryland.gov
https://www.health.state.mn.us/diseases/coronavirus/stats/vbt.html#vbtt1
https://dhhs.ne.gov/Pages/COVID-19-Weekly-Update.aspx
https://cv.nmhealth.org/wp-content/uploads/2021/11/Vaccination-Case-Report-2021-11-01.pdf
https://www.health.nd.gov/diseases-conditions/coronavirus/north-dakota-coronavirus-cases
https://www.oregon.gov/oha/covid19/Documents/DataReports/Breakthrough-Case-Report.pdf
https://www.health.pa.gov/topics/disease/coronavirus/Pages/Post-Vaccination-Data.aspx
https://ri-department-of-health-covid-19-breakthrough-cases-rihealth.hub.arcgis.com
https://coronavirus-dashboard.utah.gov/risk.html
https://dhhr.wv.gov/COVID-19/Pages/default.aspxhttps://sites.google.com/wyo.gov/covid-19/home

Actually I have no way to know if the local state reported numbers are comprised of the same individuals as the VAERS reported numbers. This information certainly though is present in a crate in a large US government warehouse with “Top Men” on it.
And certainly part of this is my “breakthrough identification filter selection efficiency” but by eye I’m seeing that in the high 80-90% range.
Case weighted is also around 7%
https://vaers.hhs.gov/faq.html — I’ll repeat from the earlier post: (emphasis theirs) “The reporting requirements for COVID-19 vaccines are the same for those authorized under emergency use or fully approved. Healthcare providers who administer COVID-19 vaccines are required by law to report to VAERS the following after vaccination:”, then at the bottom of their list, which of course also includes adverse events from the vaccine: “Cases of COVID-19 that result in hospitalization or death”
Hopefully you catch me here and say — but wait — you just used 7% to estimate the total breakthrough rate in the previous paragraph. I think there though I did so consistently, since I used the “VAERS entries where the state was reported” numbers numbers in each case. It of course assumes that the average efficiency of the non local reports is the same as the reports. Interestingly, by population there does seem to be a greater overall number of VAERS breakthrough fatality reports for the 20 “non local reporters” than 30 I found reports for. (1005 in VAERS/188k population vs 1465/150k population). It could be higher because there were more cases, or that they were more efficient getting their entries in VAERS. In terms of case rates I total up 13M cases in the states I have external reports for, out of the approximately 50M total, so it does appear the case load was also larger in the nonreporting states (in fact could imply the efficiency was worse). I’m staying with my assumption the efficiency is the same between the two sets of states.


https://www.skirsch.com/covid/Deaths.pdf
https://www.whitehouse.gov/briefing-room/press-briefings/2021/12/29/press-briefing-by-white-house-covid-19-response-team-and-public-health-officials-76/ A. Fauci: “It is noteworthy, however, that many children are hospitalized with COVID as opposed to because of COVID, reflecting the high degree of penetrance of infection among the pediatric population.” The obvious question hopefully we’ll get some handle on now is how many of the deaths we have on record are “with COVID?" vs “from COVID”?
This is a good set of observations for those of us building our intuitive bigger picture. Thank you for the citations. I hope your readership grows.